Intel Haswell-EP Xeon 12 Core Review: E5-2650L V3 and E5-2690 V3
by Ian Cutress on November 6, 2014 9:00 AM EST- Posted in
- CPUs
- IT Computing
- Intel
- Xeon
- Enterprise
- LGA2011-3
- Haswell EP
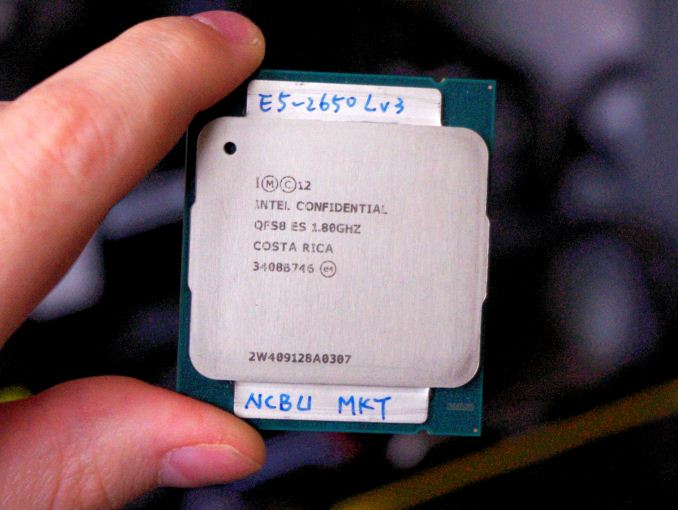
As part of our Haswell-EP coverage, the next two processors on our test beds are both 12 core variants. The E5-2650L V3 is a surprising monster, giving 12 Haswell cores at 1.8 GHz with 2.5 GHz turbo for only 65W, while the E5-2690 V3 extends the power budget to 135W for all 12 cores at a 2.6 GHz base frequency.
With Haswell-EP, the landscape of the server and workstation CPU has changed ever so slightly. In previous generations, Intel balanced core counts with frequency at the same power level. This makes a lot of sense, as you cannot add cores or frequency without drawing more power. What makes Haswell-EP feel different is a slight change in strategy as to how the new core designs are binned according to their characteristics.
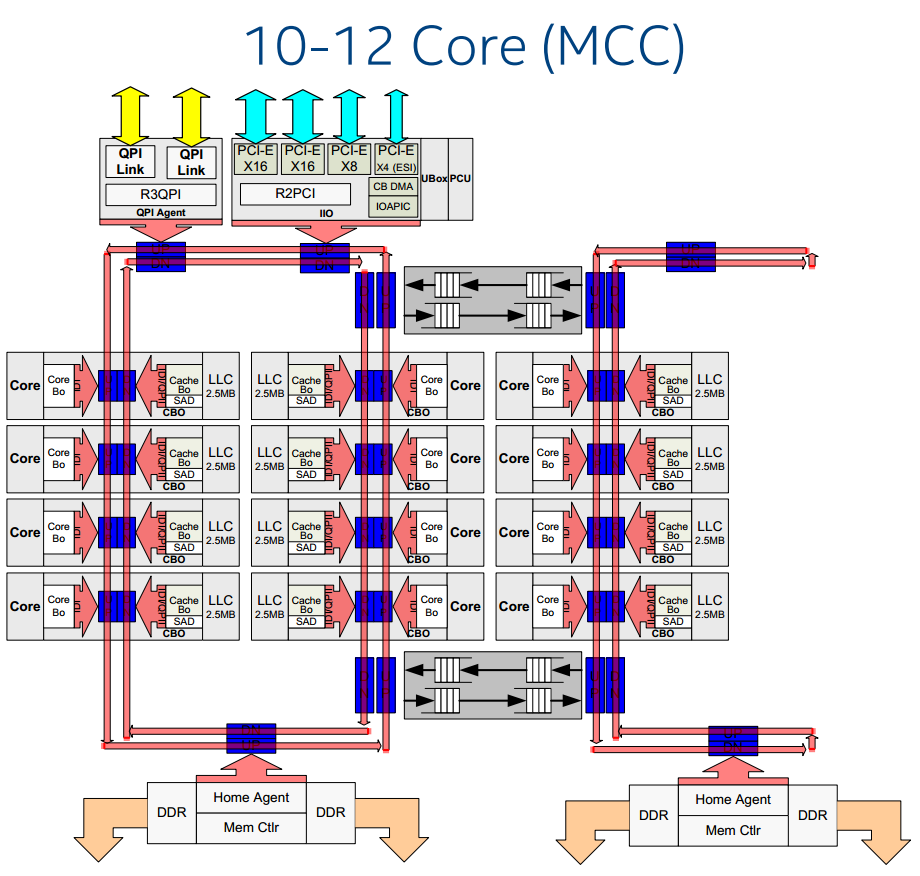
As we explained in our Haswell-EP overview and the review of our 10c samples, all Intel Haswell-EP CPUs are derived from three main die designs. These die designs all look fairly similar, varying in how many columns or cores, but this allows Intel to keep the range of designs simple but also allows them to fuse off bad cores and keep yields high.
One of the other factors in high yields is binning - the process of separating the dies into those that require less voltage for the same frequency, those that need more voltage, or those with cores that are disabled. This gives CPU manufacturers room to adjust both voltage and frequency to hit a desired power point. With Haswell-EP, Intel is being very adventurous in its goals - the same die design underpins both the CPUs in today's review, but both dies have different voltage/frequency characteristics within their power target.
Statistically, the further away from the average yield point a die is, the more money Intel can charge for it because they will end up with less of them in that bin. It is not always that easy and depends also on demand and market positioning. As discussed in the 10c review, Intel's main competition is with itself, so it has to be able to convince old customers to upgrade. By being more aggressive with die binning, this allows customers to optimize and configure the design they want.
This is why I say that the general expectation of raising cores results in a lower frequency has shifted with Haswell-EP. By being aggressive with their binning strategy, Intel can approach customers and say 'how many cores / what frequency / what power window do you need? Choose two and we can tell you what we can do on the third'. This is why processors like the E5-2650L V3 exist. A low high core count (12 cores, 24 threads), reasonable frequency part (1.8 GHz base, 2.5 GHz turbo) that has a TDP of only 65W. It sounds rather crazy.
The Market
In the broadest sense, Intel tackles several markets with the entire Haswell-EP line. At the low end we get quad core parts with lots of cache and DDR4 support aimed at memory bandwidth contained applications that do not rely on core count. Moving on up we have workstation related SKUs, extended support units, off-roadmap designs for specific customers, a lot of SKUs that won't ever reach the shelves as individual parts, parts focused on 2P compute, and others for networking, infrastructure and compute-dependent storage.
Our two CPUs today, while both 12C/24T parts, are aimed at different markets as well.
The E5-2690 V3 sits in a stack of CPUs at a 2.3-2.6 GHz base frequency but vary in their core counts. The reason why a customer moves up and down this stack is more about cost vs. performance of the part itself, with a moderate rise in power consumption as cores are added. The E5-2690 V3 has a TDP of 135W, and this kind of performance stack has been very typical since Intel's Xeon class went multicore.
The E5-2650L V3, by virtue of its 'L' designation, sits in the low power segment. The combination of high performance and low power seems like an oxymoron, however it is targeted at code that can take advantage of more cores over more frequency. Some programs do not scale with additional frequency due to other bottlenecks in the system, such as memory accesses, but can take advantage of more cores. The E5-2650L V3 does this in 65W TDP, less than half of the E5-2690 V3.
| Intel Xeon E5 2600 v3 SKU Comparison | ||||
| Xeon E5 | Cores/ Threads |
TDP | Clock Speed (GHz) Base - Turbo |
Price |
| High Performance (35-45MB LLC) | ||||
| 2699 v3 | 18/36 | 145W | 2.3-3.6 | $4115 |
| 2698 v3 | 16/32 | 135W | 2.3-3.6 | $3226 |
| 2697 v3 | 14/28 | 145W | 2.6-3.6 | $2702 |
| 2695 v3 | 14/28 | 120W | 2.3-3.3 | $2424 |
| "Advanced" (20-30MB LLC) | ||||
| 2690 v3 | 12/24 | 135W | 2.6-3.5 | $2090 |
| 2685 v3 | 12/24 | 120W | 2.6-3.5 | $2090 |
| 2680 v3 | 12/24 | 120W | 2.5-3.3 | $1745 |
| 2660 v3 | 10/20 | 105W | 2.6-3.3 | $1445 |
| 2658 v3 (E) | 12/24 | 105W | 2.2-2.9 | $1832 |
| 2650 v3 | 10/20 | 105W | 2.3-3.0 | $1167 |
| Midrange (15-25MB LLC) | ||||
| 2640 v3 | 8/16 | 90W | 2.6-3.4 | $939 |
| 2630 v3 | 8/16 | 85W | 2.4-3.2 | $667 |
| 2620 v3 | 6/12 | 85W | 2.4-3.2 | $422 |
| Frequency optimized (10-20MB LLC) | ||||
| 2687W v3 | 10/20 | 160W | 3.1-3.5 | $2141 |
| 2667 v3 | 8/16 | 135W | 3.2-3.6 | $2057 |
| 2643 v3 | 6/12 | 135W | 3.4-3.7 | $1552 |
| 2637 v3 | 4/8 | 135W | 3.5-3.7 | $996 |
| Budget (15MB LLC) | ||||
| 2609 v3 | 6/6 | 85W | 1.9 | $306 |
| 2603 v3 | 6/6 | 85W | 1.6 | $213 |
| Power Optimized (20-30MB LLC) | ||||
| 2650L v3 | 12/24 | 65W | 1.8-2.5 | $1329 |
| 2648L v3 (E) | 12/24 | 75W | 1.8-2.5 | $1544 |
| 2630L v3 | 8/16 | 55W | 1.8-2.9 | $612 |
In terms of upfront cost, the E5-2690 V3 follows the pattern of rising cost compared to the other 2.3-2.6 GHz parts and sits around the $2090 mark. The E5-2650L V3 however comes across as a bit expensive to begin with (~$1329), but the idea here is that for a 2P system limited to 135W, you can either have a single E5-2690 V3 with 12 cores at 2.6 GHz for $2090, or two E5-2650L V3 CPUs with 24 cores at 1.8 GHz for $2660. If you don't mind the ~30% price difference and have the software to take advantage, it is almost a no-brainer comparison.
There is a distinct rider on this however, as it comes down to the software in use. As we have discovered over the last couple of years, most off the shelf software does not scale to more sockets, or even worse, reduces in performance due to memory mismanagement across the two CPUs. So on paper, if the software used ticks all the boxes, a dual E5-2650L V3 system sounds like a good deal.

The frequency response of the 12-core lineup for E5 26xx v3 CPUs puts the two L CPUs at the same frequency but a 10W difference in power consumption. The E5-2690 v3 heads the top of the list, with the 2685 v3 and 2670 v3 taking the biggest drop between single core and multi-core performance. The 2670 v3 spreads the drop over more cores in use, finally reaching its multi-core frequency when half the CPU is loaded, rather than 5/12.
Test Setup
For our testing, it is worth noting that our CPU samples arrived at different times and due to the testing setup at the time, certain benchmarks were unable to be run due to updates required. We were also able to source a second E5-2650L V3 and a 2P motherboard, allowing the comparison between the two CPUs on their own and a 130W combination.
| Test Setup | |
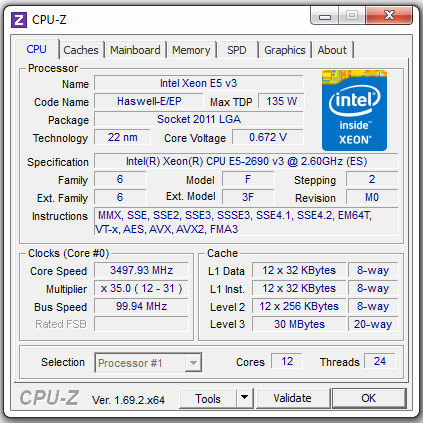
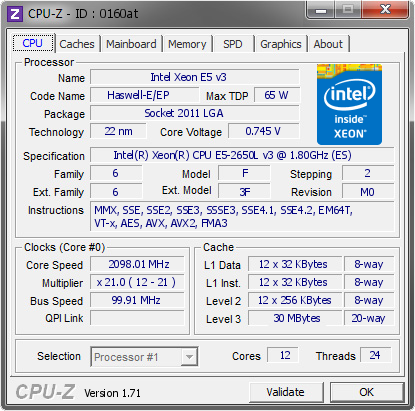
| Processor | Intel Xeon E5-2690 V3 (135W), 12C/24T: 2.6 GHz (3.5 GHz Turbo) Intel Xeon E5-2650L v3 (65W), 12C/24T: 1.8 GHz (2.5 GHz Turbo) |
| Motherboards | ASUS X99-Deluxe ASRock X99 Extreme6 GIGABYTE MD60-SC0 |
| Cooling | Cooler Master Nepton 140XL Corsair H80i Thermalright TRUE Copper |
| Power Supply | OCZ 1250W Gold ZX Series Corsair AX1200i Platinum PSU |
| Memory | ADATA XPG Z1 DDR4-2400 8x8 GB 1.2V Corsair DDR4-2133 C15 4x8 GB 1.2V G.Skill Ripjaws 4 DDR4-2133 C15 4x8 GB 1.2V |
| Memory Settings | JEDEC @ 2133 |
| Video Cards | AMD R7 240 DDR3 |
| Video Drivers | AMD Catalyst 13.11 |
| Hard Drive | OCZ Vertex 3 256GB |
| Optical Drive | LG GH22NS50 |
| Case | Open Test Bed |
| Operating System | Windows 7 64-bit SP1 |
Many thanks to...
We must thank the following companies for kindly providing hardware for our test bed:
Thank you to OCZ for providing us with PSUs and SSDs.
Thank you to G.Skill and ADATA for providing us with memory.
Thank you to Corsair for providing us with memory, an AX1200i PSU and a Corsair H80i CLC.
Thank you to MSI for providing us with the NVIDIA GTX 770 Lightning GPUs.
Thank you to Rosewill for providing us with PSUs and RK-9100 keyboards.
Thank you to ASRock for providing us with some IO testing kit.
Thank you to Cooler Master for providing us with Nepton 140XL CLCs.
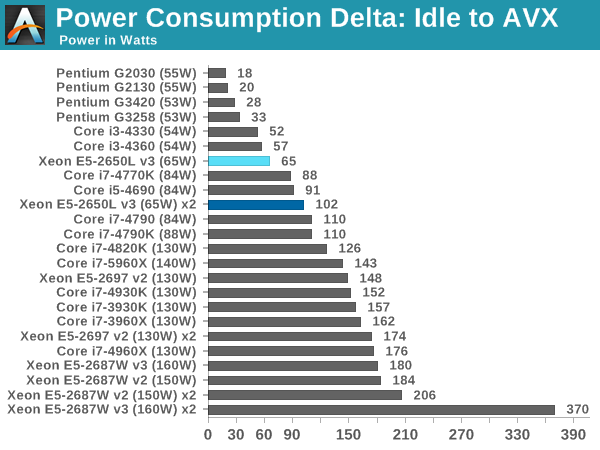
Load Delta Power Consumption
Power consumption was tested on the system with a wall meter connected to the power supply. This power supply is Gold rated, and as I am in the UK on a 230-240 V supply, leads to ~75% efficiency > 50W, and 90%+ efficiency at 250W, suitable for both idle and multi-GPU loading. This method of power reading allows us to compare the power management of the UEFI and the board to supply components with power under load, and includes typical PSU losses due to efficiency.
We take the power delta difference between idle and load as our tested value, giving an indication of the power increase from the CPU when placed under stress. Unfortunately due to the timing of our testing, we were unable to check the power difference of the E5-2690 v3.
Overclocking on a Xeon?
Similar to our last Xeon review, multiplier overclocking on the E5-2600 V3 series is disabled. Nevertheless with the right motherboard users can adjust the BCLK to add a few percent more performance within the stock frequency. Our E5-2600 V2 testing yielded 110 MHz AVX stable for a +10% boost, but the 10-core E5-2600 V3 CPU we tested only gave 104 MHz. Today we are testing the E5-2650L V3, which should arguably have at least the power headroom if the stock voltage is set a little high by Intel.
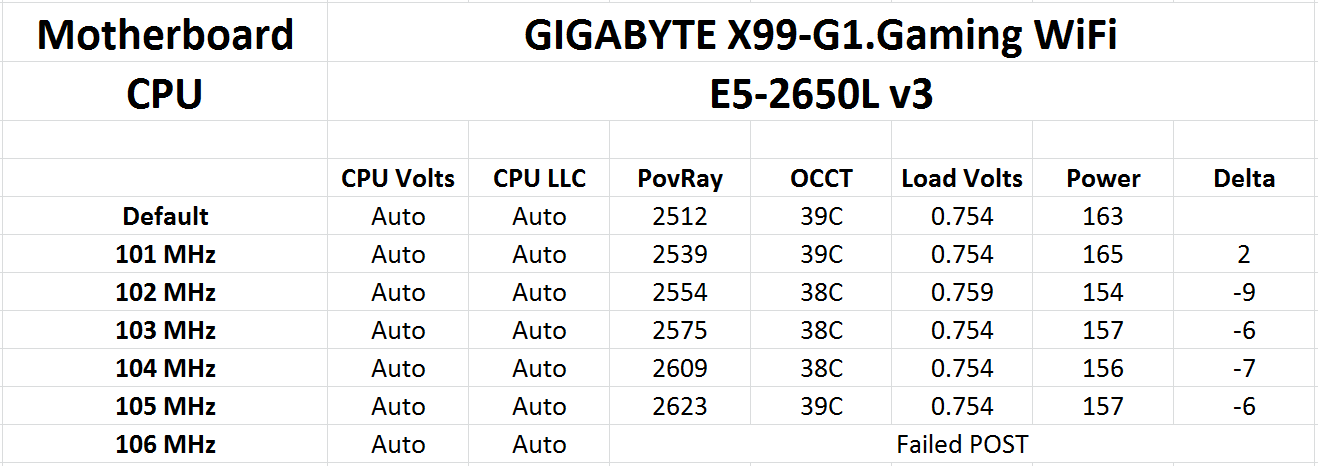
Similarly to the E5-2687W V3, the moment we hit a frequency the system does not like, it returns as a complete failed POST rather than a BSOD. However, we did manage a 5% boost in base frequency, giving a 4.4% rise in POV-Ray scores. The load voltage remained constant, and despite the frequency raising the power margins were all within a 9W window from stock usage.


52 Comments
View All Comments
XZerg - Thursday, November 6, 2014 - link
I really dislike the Power Consumpution Delta chart. Could you please go back to separate Idle chart and Load chart?Mikemk - Thursday, November 6, 2014 - link
+1klagermkii - Thursday, November 6, 2014 - link
I don't understand the purpose of that chart. It leaves too much ambiguity between CPUs that are efficient at load vs CPUs that just have poor idle power management.ziorus - Thursday, November 6, 2014 - link
100% agree with XZerg. I was coming to this site because you had the idle and load charts. Those two infos really are needed. Not this delta chart. We do not even know where power consumption in watts at idle starts to add in the numbers.Guspaz - Thursday, November 6, 2014 - link
Agreed. The delta is basically useless information, because it gives a CPU with a power range of 10W-20W and a CPU with a power range of 100W-110W the same score, and tells us nothing about how much power the part actually draws (so we can't use the info to size PSUs) or how much heat it might produce (so we can't use the info to size cooling).The delta is, without the idle/load, completely meaningless.
Schafdog - Thursday, November 6, 2014 - link
I want to join the club to complain on only one (delta) power measurement. Idle is important. Max is important.MrCommunistGen - Saturday, November 8, 2014 - link
I think that the Delta chart is designed to give an apples to apples comparison of how much power the CPU itself consumes under load. The platforms of all of those systems are vastly different. There's a range of motherboards from single socket consumer IVB to dual socket workstation/server Haswell and everything in between. While a comparison of raw platform power under idle and load certainly bears its own merit and and represents an interesting set of figures, it does not provide a meaningful comparison for the subject of this article - a CPU.Delta power allows for all kinds of comparisons. Regardless of motherboard, RAM, etc you can establish that a given CPU will use (approximately) X number of watts under load. If you then provide performance figures for that load, you can get the compute efficiency of the CPU. In big data clusters, especially ones that primarily perform a specific workload this is an important figure.
0ldman79 - Monday, November 10, 2014 - link
Delta chart is fine. We still want to see idle and max load.Call me old fashioned.
danjw - Thursday, November 6, 2014 - link
First paragraph in "Market" "bandwidth contained applications" should be "bandwidth constrained applications", I think.rocketscience315 - Thursday, November 6, 2014 - link
Um, isn't the Frequency Response graph missing the 2648L?