GIGABYTE GA-J1800N-D2H Review: Dual Core Bay Trail-D at $69
by Ian Cutress on December 26, 2014 11:00 AM EST- Posted in
- Motherboards
- Intel
- Bay Trail
System and Motherboard Performance
Power Consumption
Power consumption was tested on the system while with a wall meter connected to the Rosewill 500W Platinum power supply. As this power supply is Platinum rated and as I am in the UK on a 230-240 V supply, this leads to ~75% efficiency > 20W, and 92%+ efficiency at 50W, suitable for both idle and multi-GPU loading. This method of power reading allows us to compare the power management of the UEFI and the board to supply components with power under load, and includes typical PSU losses due to efficiency. These are the real world values that consumers may expect from a typical system (minus the monitor) using this motherboard.
While this method for power measurement may not be ideal, and you feel these numbers are not representative due to the high wattage power supply being used, the important point to take away is the relationship between the numbers. These boards are all under the same conditions, and thus the differences between them should be easy to spot.
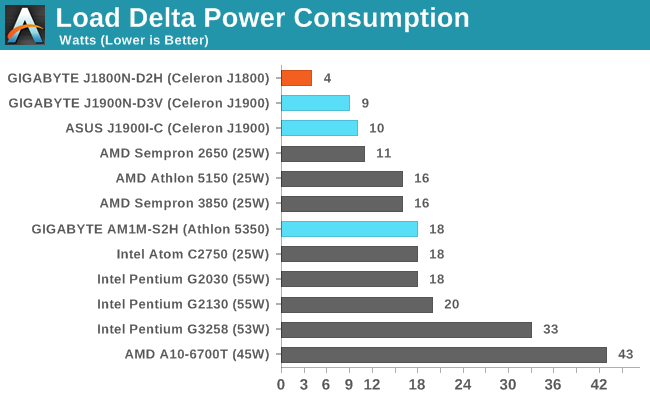
Despite being rated for a 10W TDP, the J1800 measures only 4W difference between idle and load. The J1900 is also rated at 10W TDP, but gives 9W/10W due to the extra cores.
Windows 7 POST Time
Different motherboards have different POST sequences before an operating system is initialized. A lot of this is dependent on the board itself, and POST boot time is determined by the controllers on board (and the sequence of how those extras are organized). As part of our testing, we look at the POST Boot Time using a stopwatch. This is the time from pressing the ON button on the computer to when Windows 7 starts loading. (We discount Windows loading as it is highly variable given Windows specific features.)
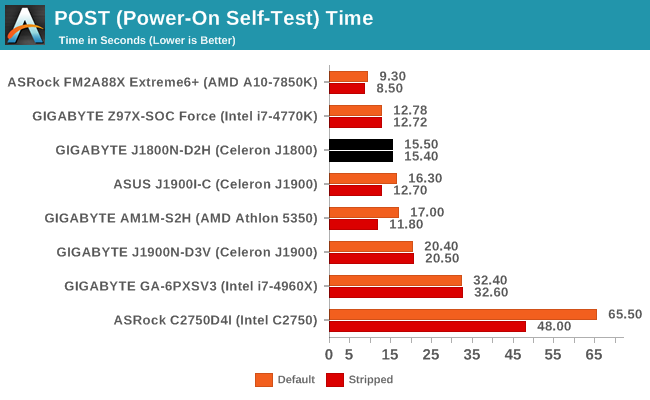
Out of the Bay Trail-D boards tested so far, the J1800N-D3H comes top for default POST times.
Rightmark Audio Analyzer 6.2.5
Rightmark:AA indicates how well the sound system is built and isolated from electrical interference (either internally or externally). For this test we connect the Line Out to the Line In using a short six inch 3.5mm to 3.5mm high-quality jack, turn the OS speaker volume to 100%, and run the Rightmark default test suite at 192 kHz, 24-bit. The OS is tuned to 192 kHz/24-bit input and output, and the Line-In volume is adjusted until we have the best RMAA value in the mini-pretest. We look specifically at the Dynamic Range of the audio codec used on board, as well as the Total Harmonic Distortion + Noise.
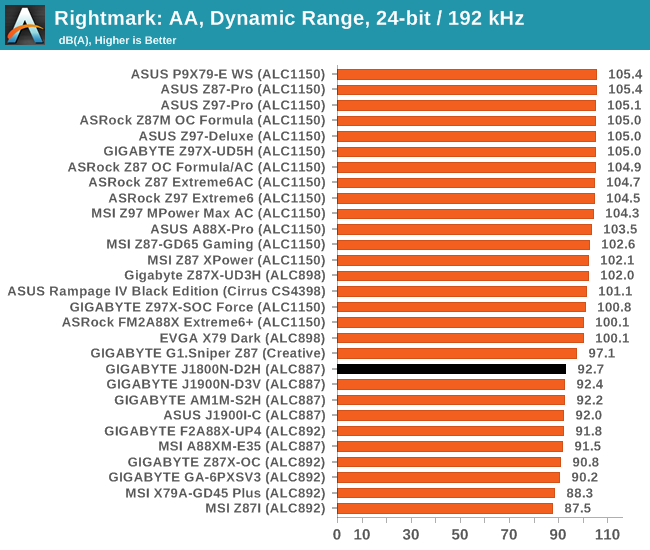
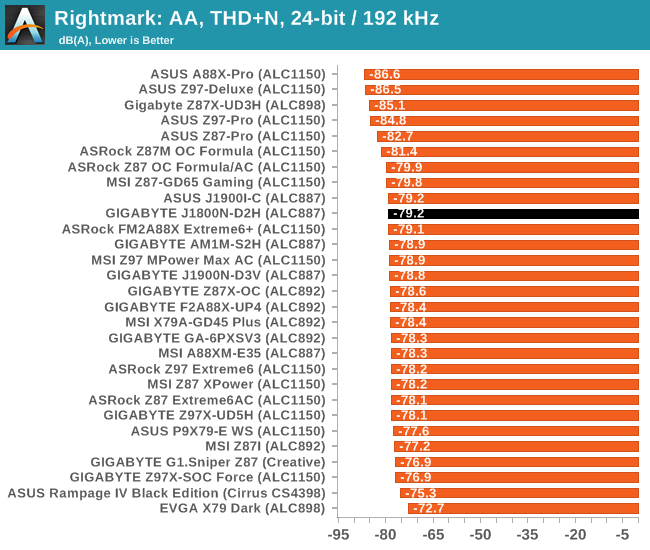
With all the motherboards in this test using the ALC887, there is not much to choose between them.
USB Backup
For this benchmark, we transfer a set size of files from the SSD to the USB drive using DiskBench, which monitors the time taken to transfer. The files transferred are a 1.52 GB set of 2867 files across 320 folders – 95% of these files are small typical website files, and the rest (90% of the size) are small 30 second HD videos. In an update to pre-Z87 testing, we also run MaxCPU to load up one of the threads during the test which improves general performance up to 15% by causing all the internal pathways to run at full speed.
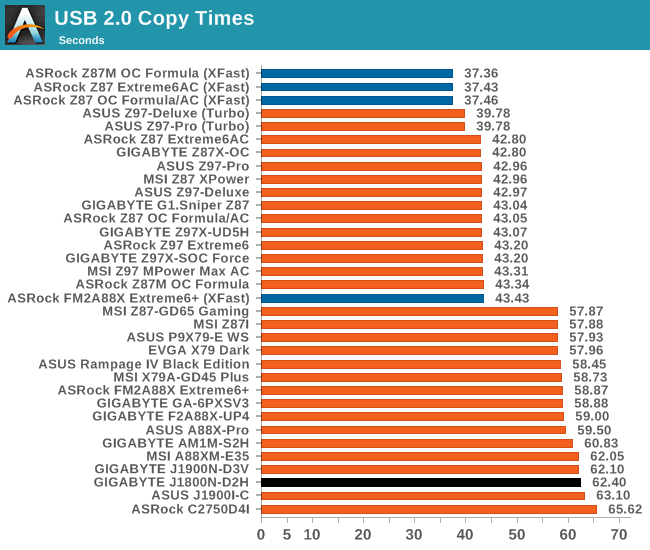
Compared to the high end motherboards that perform our USB 2.0 tests around 42 seconds, the Bay Trail IO is relatively slow.
DPC Latency
Deferred Procedure Call latency is a way in which Windows handles interrupt servicing. In order to wait for a processor to acknowledge the request, the system will queue all interrupt requests by priority. Critical interrupts will be handled as soon as possible, whereas lesser priority requests such as audio will be further down the line. If the audio device requires data, it will have to wait until the request is processed before the buffer is filled.
If the device drivers of higher priority components in a system are poorly implemented, this can cause delays in request scheduling and process time. This can lead to an empty audio buffer and characteristic audible pauses, pops and clicks. The DPC latency checker measures how much time is taken processing DPCs from driver invocation. The lower the value will result in better audio transfer at smaller buffer sizes. Results are measured in microseconds.
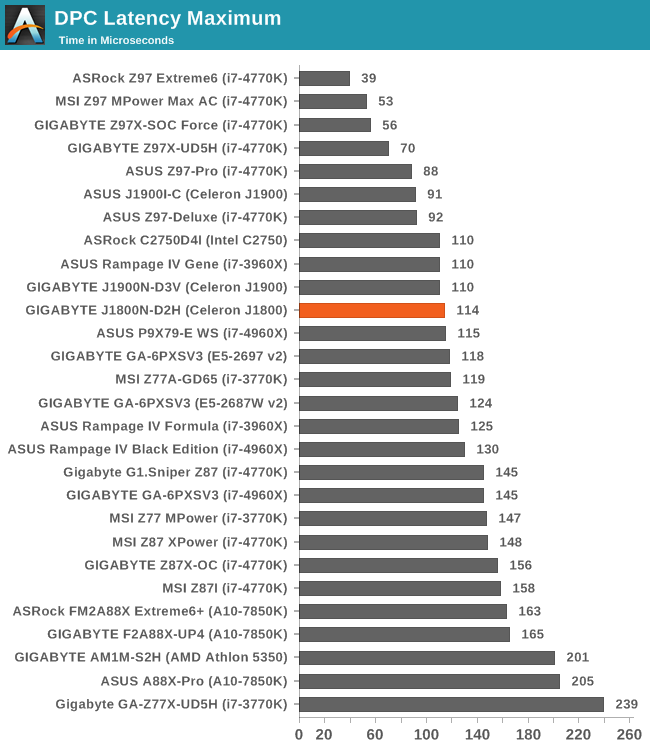
Despite being motherboards with low power CPUs, the DPC latency is around the 100 microsecond mark which is a good sign.


38 Comments
View All Comments
ddriver - Saturday, December 27, 2014 - link
With 6 and 8 TB drives available, I'd say it would be ample for many users. It will still do more good than it would ever do as a gaming box.Plus there is a PCI-E slot, not useful for a GPU, especially with such a weak integrated CPU, but you can plug in a HDD controller card, there are PCI-E x1 controllers with 2, 4 and even 6 SATA ports.
III-V - Saturday, December 27, 2014 - link
The audience of this article is likely going to be able to relate most with gaming benchmarks. Also, have you no curiosity in how hardware like this is able to run modern games?Pretty rude and shortsighted response.
ddriver - Sunday, December 28, 2014 - link
I bet everyone is wondering how good the product is at a task it is not intended for and will never be used at. That's like reviewing clothing based on the way it tastes.ddriver - Sunday, December 28, 2014 - link
BTW I don't think it is very smart of you to call "smart and on the point" "rude and shortsighted" ;) If anything, it makes you rude and shortsighted, and also a hypocrite for calling others what you are...Morawka - Sunday, December 28, 2014 - link
you were rude, now hush and run alongOxford Guy - Saturday, December 27, 2014 - link
What a product was intended for is one thing. Total/overall performance is another. If you're not interested in certain benchmarks that's your business.XZerg - Friday, December 26, 2014 - link
Normally i would avoid cursing but after numerous attempts to provide feedback on stopping these retarded Load Delta Charts I have just lost it.ian - seriously - grow a f**king blub in the brain and realize that the Load Delta Chart is absolutely f**king stupid - especially when you are reviewing a product where Idle numbers matter the most. Just go back to separate Idle and Load charts. Why is it just so f**king hard for you to realize that?!
Throwaway007 - Saturday, December 27, 2014 - link
I signed up just to say the same thing.I bet Ian probably introduces himself on various dating sites as having a penile length delta of 2 inches.
Sounds like this man is hiding something.
BrokenCrayons - Tuesday, December 30, 2014 - link
I usually don't make comments, but lately it seems like this should be mentioned as much as possible. AT articles unceasingly flog OEMs for junk TN panels and the use of mechanical storage in an apparent attempt to change the direction of the industry. I think it's the responsibility of the readers to therefore repeatedly point out that delta charts for power consumption are not what we want.I am glad there was at least a more reasonable PSU used in this review. 500 watts is a lot closer to what might be considered appropriate for low-consumption equipment than 1200, but the delta chart isn't just annoying, it's uninformative and utterly stupid. If you're going to be bothered with measuring idle and load wattage, why not just post the bloody numbers? I'm sure we, the readers, can handle a little bit of subtraction on our own if we want delta values. So yes, like in other recent articles, I completely support the posting of actual wattage values and +1 the carpet bombing of profanity in the post above as, at this point, earned and deserved.
ant6n - Friday, December 26, 2014 - link
If it had 4 SATAs it could make a good file server.