The Intel SSD DC P3700 Review Part 2: NVMe on Client Workloads
by Anand Lal Shimpi on June 10, 2014 12:07 AM EST- Posted in
- Storage
- SSDs
- Intel
- Intel SSD DC P3700
- NVMe
Random Read/Write Speed
The four corners of SSD performance are as follows: random read, random write, sequential read and sequential write speed. Random accesses are generally small in size, while sequential accesses tend to be larger and thus we have the four Iometer tests we use in all of our reviews.
Our first test writes 4KB in a completely random pattern over an 8GB space of the drive to simulate the sort of random access that you'd see on an OS drive (even this is more stressful than a normal desktop user would see). We perform three concurrent IOs and run the test for 3 minutes. The results reported are in average MB/s over the entire time.
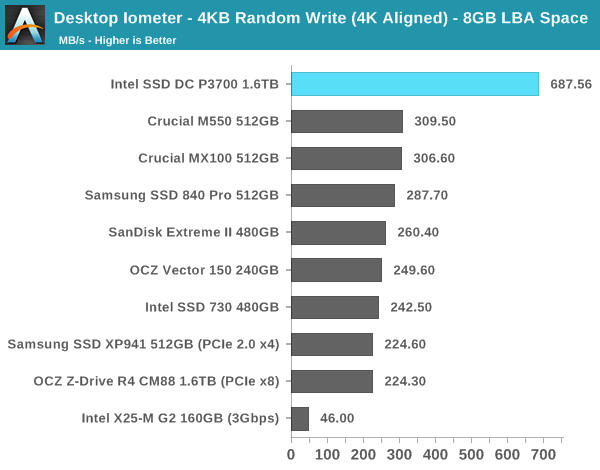
Our enterprise look at the P3700 focused on steady state 4KB random write performance, but surprisingly enough our short burst/8GB LBA space testing puts the P3700 at a very similar performance level. Here the P3700 is more than twice as fast as the closest SATA competitor, which is amazing despite the low queue depth of our test. I also included the old X25-M G2 to show just how far we've come - the P3700 is nearly 15x the speed of Intel's first generation MLC SSD controller.
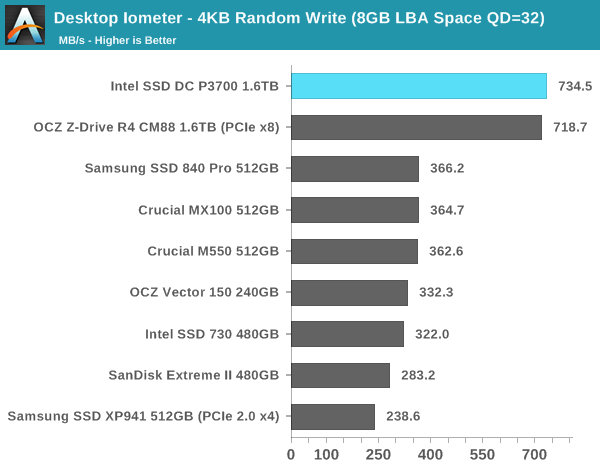
At a higher queue depth the Z-Drive R4 is able to catch up to the P3700, but being able to deliver excellent random IO performance even at low queue depths is a staple of a good client drive.
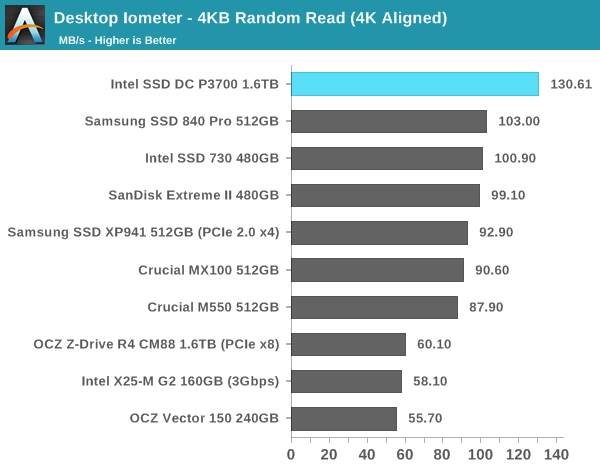
Random read performance is better than anything else here, but there's a limit to how much parallelism you can extract from a low queue depth random read workload.
Sequential Read/Write Speed
To measure sequential performance we run a 1 minute long 128KB sequential test over the entire span of the drive at a queue depth of 1. The results reported are in average MB/s over the entire test length.
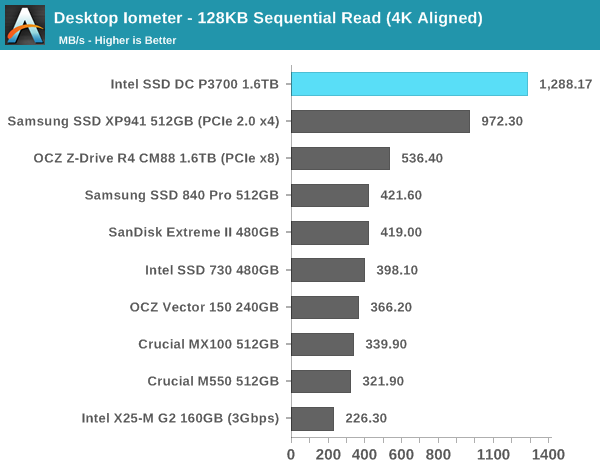
Once again we see the P3700 does extremely well at low queue depths, here its sequential read performance is substantially better than anything else.
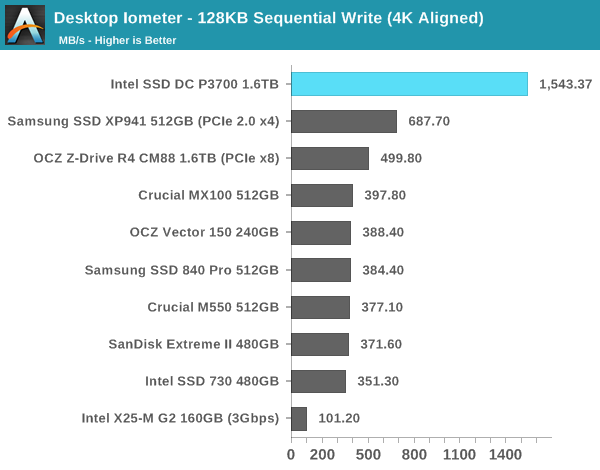
Sequential writes are even more impressive. We typically never see this sort of performance at a queue depth of 1. The P3700's 18-channel controller and firmware do a good job of splitting up write requests across as many parallel die as possible. Once again comparing the P3700 to the old X25-M G2 we see 15x the performance in 6 years.
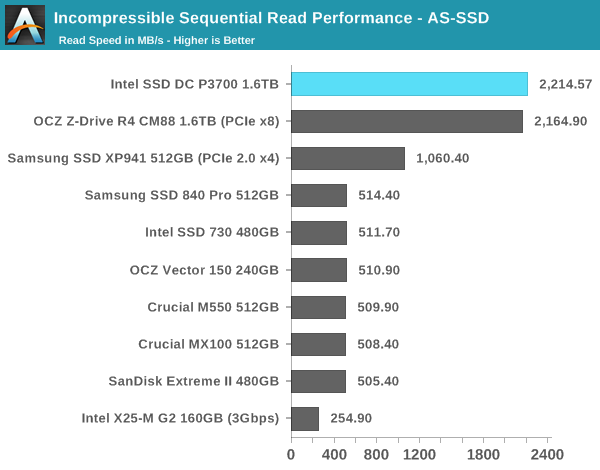
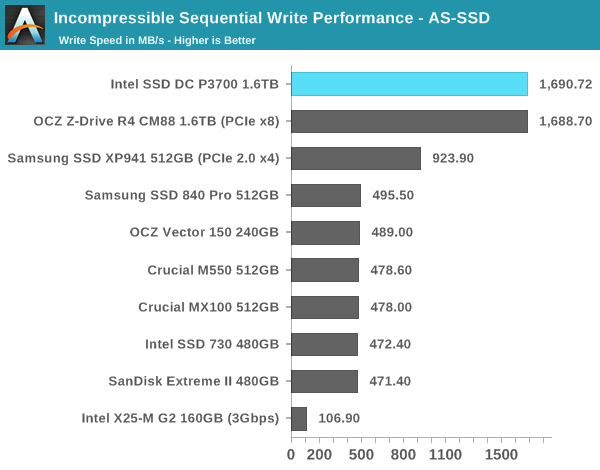
AS-SSD Incompressible Sequential Read/Write Performance
The AS-SSD sequential benchmark uses incompressible data for all of its transfers. The result is a pretty big reduction in sequential write speed on SandForce based controllers. At a higher queue depth the P3700's performance scales even further. It used to only be possible to see these numbers on PCIe SSDs that leveraged multiple controllers.


36 Comments
View All Comments
[-Stash-] - Tuesday, June 10, 2014 - link
Will be great to see how the 35 and 36 perform in the client workloads – really quite excited about these.romrunning - Tuesday, June 10, 2014 - link
In the 25% OP 4KB Random Write (QD32) graph, the Samsung XP941 showed a massive drop between its 512GB and 384GB (25% spare area) results. From 30k down to 5k - is that an anomaly?Also, what's with the vertical scale showing 1, 10, and 100 ranges? That forces all of the data points into a much smaller range, and it's visually not as informative.
Kristian Vättö - Tuesday, June 10, 2014 - link
Are you sure you are not mixing up the graphs? With 25% spare area, the results are better (~30K IOPS), which is how things should be.romrunning - Tuesday, June 10, 2014 - link
I see - the two charts on the bottom of page one are same but with different vertical scales (as explained so well by DanNeely below).Yes, I suppose instead of calling it a drop, you could say it's actually a rise from 5k to 30k IOPs when you go 25% spare area. It seems Samsung drives especially like extra spare area.
DanNeely - Tuesday, June 10, 2014 - link
It's called a log scale; and generally is the better choice when you've got values spanning more than 2 or 3 orders of magnitude (ie more than 100x or 1000x). A linear scale would crush everything but the largest values into a tiny area at the bottom. With the highly consistent performance of the DC P3700 it's not as big a concern; but with the less consistent behavior of most consumer or older enterprise drives it's the only good way to see the behavior. Look at the Samsung 840; it has peak IOPS of ~100,000; drops to a steady state behavior mostly between ~3000-9000 but with occasional excursions as low as ~110.Also, the tests are being done to show consistency of performance, a log scale makes seeing that much easier because the same vertical distance between min and max always represents the same multiple (eg 2x 3x 10x) between the values; a linear scale would mask inconsistency in slower drives while exaggerating it in higher performing ones because because 20000-22000 is a much larger interval on a linear scale than 10-1000 despite the former being a highly consistent drive with 10% variation and the latter having a 100x variation.
ryanjacoby2 - Tuesday, June 10, 2014 - link
I'm enjoying the pivotchart type graphs you guys transitioned to a while ago. Makes readability and comparisons a breeze without the clutter, thanks for the change!uruturu - Tuesday, June 10, 2014 - link
why don't you test the same drives also with 25% OP in storage bench 2013?samsung 840 pro (25% OP) vs sandisk extreme II (25% OP)...factory settings seem to penalize some drives.
morganf - Tuesday, June 10, 2014 - link
I thought the same thing. The 2013 storage bench writes an insane amount of data in a short time. If someone really cares about performance with such a heavy write-load, then they would certainly overprovision their SSD. The P3700 obviously already comes from the factory with a lot of OP. It only makes sense to also OP the Samsung 840 Pro and other drives, as a point of comparison, when running the 2013 Storage bench.To be clear, I mean to run the 2013 Storage Bench on each SSD with and without OP.
eanazag - Tuesday, June 10, 2014 - link
When's the Intel giveaway for the P3700?extide - Tuesday, June 10, 2014 - link
LOL! Yeah, SIGN ME UP!! Haha ;)