The Intel Haswell Refresh Review: Core i7-4790, i5-4690 and i3-4360 Tested
by Ian Cutress on May 11, 2014 3:01 AM ESTCPU Synthetic Benchmarks
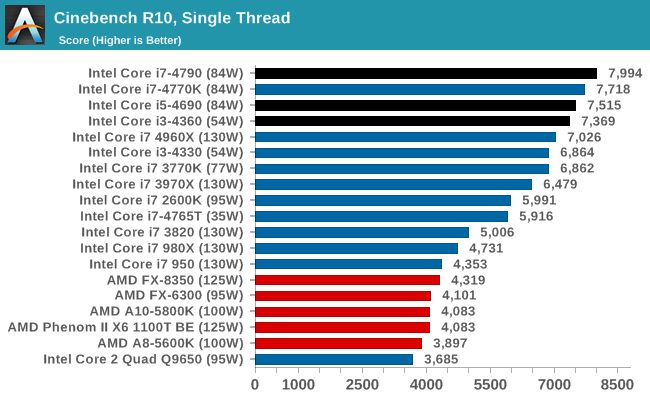
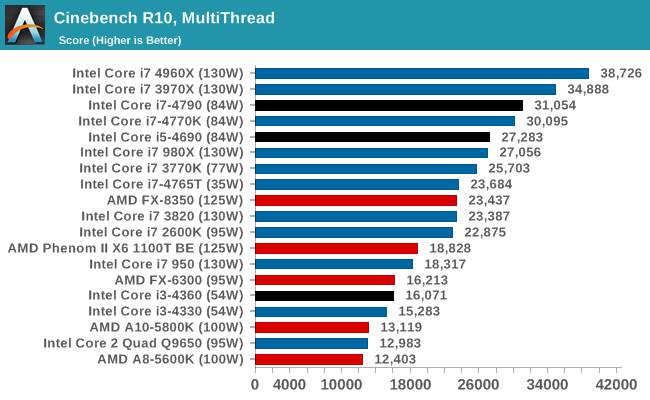
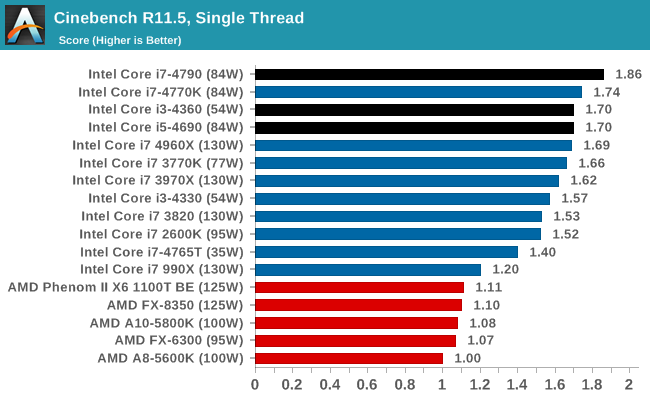
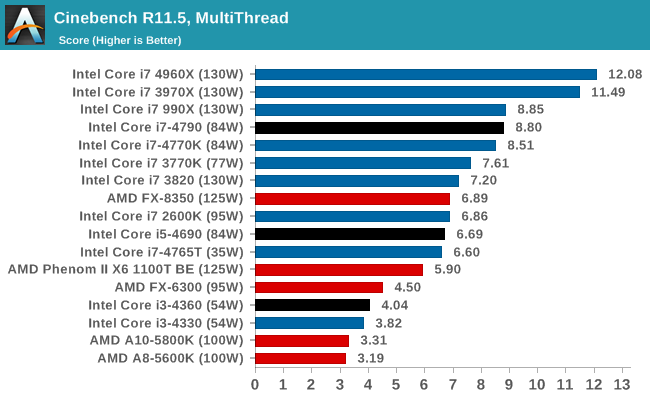
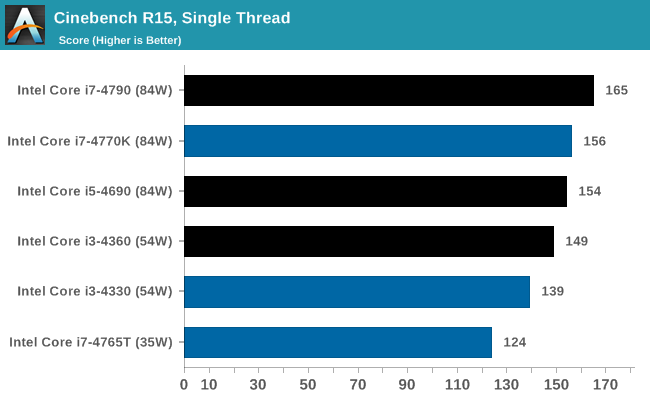
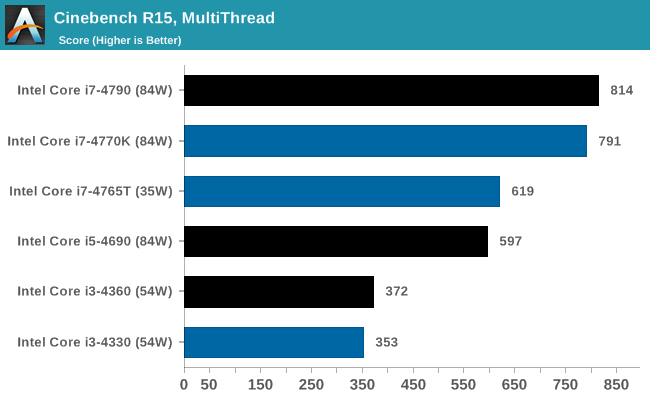
Content Creation - Cinebench
Based on MAXON’s CINEMA 4D animation software, Cinebench is used to determine the CPU and graphics performance via OpenGL. The software has gone through many iterations over the years, and here we use versions 10, 11.5 and 15 to compare single-threaded and multi-threaded CPU performance. As the generations increase, the software becomes more multithread aware and scales better, however for consistency with older results we keep the version 10 results in our database.
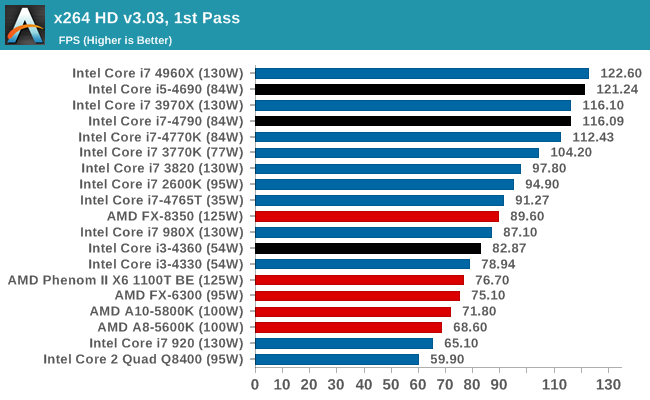
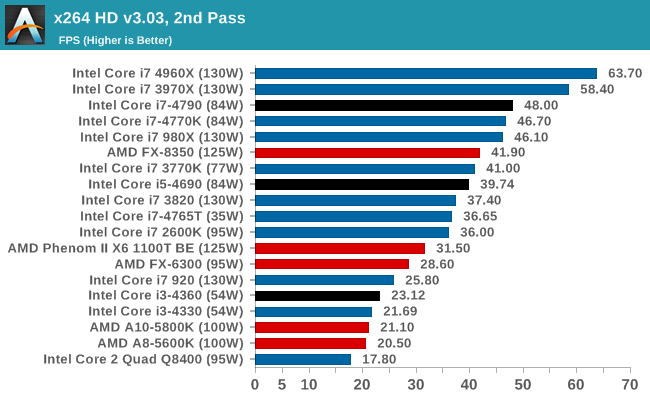
Video Conversion - x264 HD 3.03 Benchmark
Graysky's x264 HD test uses x264 to encode a 4Mbps 720p MPEG-2 source. The focus here is on quality rather than speed, thus the benchmark uses a 2-pass encode and reports the average frame rate in each pass.
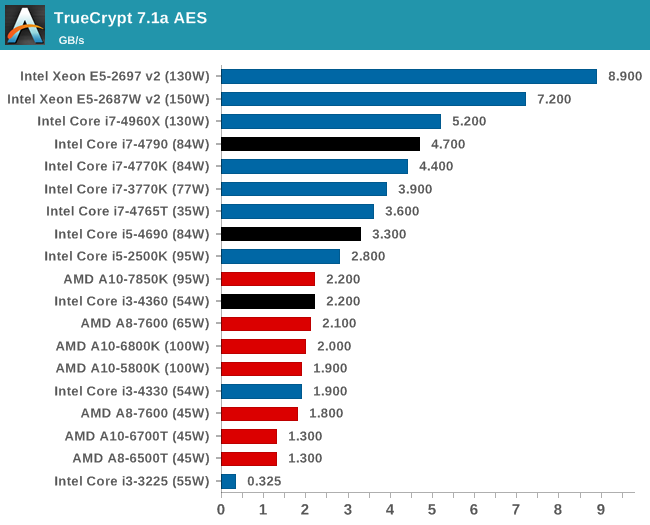
Encryption –TrueCrypt v0.7.1a: link
TrueCrypt is an off the shelf open source encryption tool for files and folders. For our test we run the benchmark mode using a 1GB buffer and take the mean result from AES encryption.
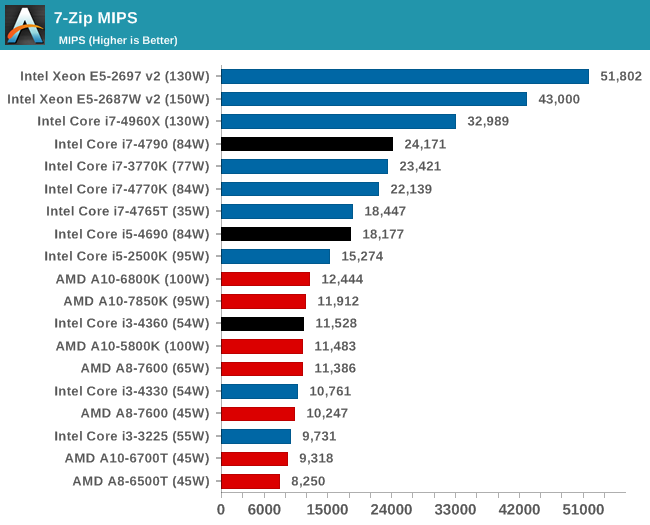
Synthetic – 7-Zip 9.2: link
As an open source compression tool, 7-Zip is a popular tool for making sets of files easier to handle and transfer. The software offers up its own benchmark, to which we report the result.
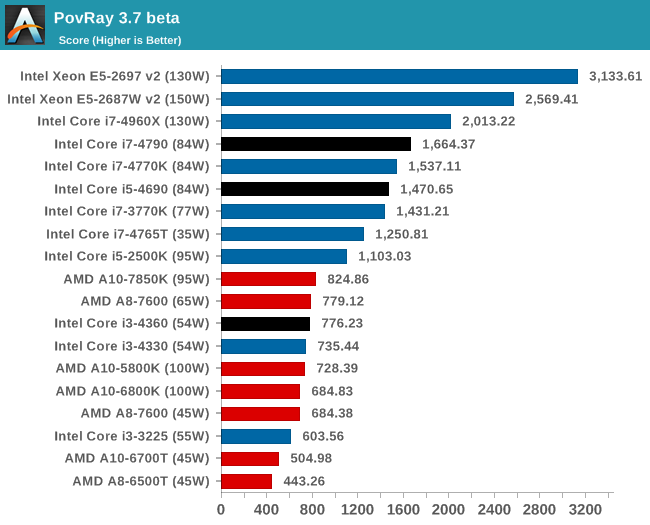
Rendering – PovRay 3.7: link
The Persistence of Vision RayTracer, or PovRay, is a freeware package for as the name suggests, ray tracing. It is a pure renderer, rather than modeling software, but the latest beta version contains a handy benchmark for stressing all processing threads on a platform. We have been using this test in motherboard reviews to test memory stability at various CPU speeds to good effect – if it passes the test, the IMC in the CPU is stable for a given CPU speed. As a CPU test, it runs for approximately 2-3 minutes on high end platforms.
Console Emulation –Dolphin Benchmark: link
At the start of 2014 I was emailed with a link to a new emulation benchmark based on the Dolphin Emulator. The issue with emulators tends to be two-fold: game licensing and raw CPU power required for the emulation. As a result, many emulators are often bound by single thread CPU performance, and general reports tended to suggest that Haswell provided a significant post to emulator performance. This benchmark runs a Wii program that raytraces a complex 3D scene inside the Dolphin Wii emulator. Performance on this benchmark is a good proxy of the speed of Dolphin CPU emulation, which is an intensive single core task using most aspects of a CPU. Results are given in minutes, where the Wii itself scores 17.53; meaning that anything above this is faster than an actual Wii for processing Wii code, albeit emulated.
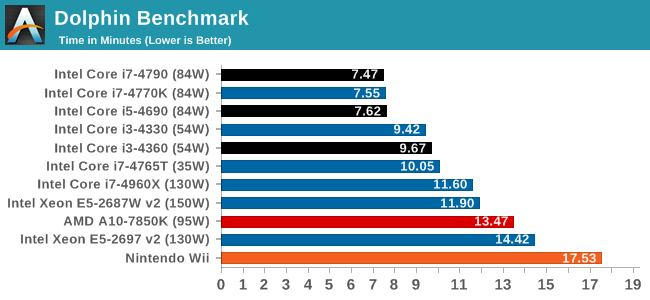
Dolphin relies very much on architecture as well as CPU single thread speed. It would also stand to reason that there is a small about of thread switching going on, given how far off the i3 and i7-4765T CPUs are.


130 Comments
View All Comments
roxamis - Monday, May 12, 2014 - link
Take the measurement as qualitative not quantitive.Power consumption at the wall doesn't mean much as a number. Its wrong on many levels, only one of which is the PSU efficiency. It doesn't really matter what % is the load, you measure one thing and you try to deduce something else
Wall plug wattmeters can't measure PSUs correclty anyway. Take these numbers with a grain of salt.
MrSpadge - Monday, May 12, 2014 - link
The way it is done now fold the power efficiency curve of the PSU (which is rather steep at low loads) with the actual differences between components (which is what we actually want to measure). Noting that the method in general is not very precise doesn't change this.And since power consumption is not plotted for the multi-GPU setups (and doesn't need to, for such an article) it's not necessary to keep the PSU similar across all configurations. I'd rather have a flat PSU curve for all CPUs - this way I could better judge the differences between them.
rajod1 - Friday, May 30, 2014 - link
Wall power readings do mean something to some people just not you.wpcoe - Sunday, May 11, 2014 - link
The chart comparing the three new Haswell Refresh CPUs with the three previous counterparts shows the i3-4330 as 3500 base frequency, but all the benchmarks following a bit later show the i3-4330 as 3.6Ghz. The ark.intel.com page shows the i3-4330 to be 3.5Ghz, so I think maybe the benchmarks have an incorrect speed?Ian Cutress - Sunday, May 11, 2014 - link
It was just those power test graphs that had it mistyped, my bad. Review updated, 3.5 GHz is the correct frequency.The0ne - Sunday, May 11, 2014 - link
The separation of desktop and workstation hasn't changed. It is technology that has changed and allowed for smaller, faster, quieter, more energy efficient hardware to be use. I felt it was unnecessary to give labels to something such as this. Human-Limiting?bji - Sunday, May 11, 2014 - link
"Human limited" vs "CPU limited" is a much, much clearer way of saying what the author is trying to say than is an artificial definition of "workstation" vs. "desktop" that you are proposing.Flunk - Monday, May 12, 2014 - link
Splitting workstation and desktop has always been about fleecing more money out of people for top end systems. There really isn't a practical difference.Smile286 - Sunday, May 11, 2014 - link
What about temperatures? Are those Haswell Refresh processors less hotter or not?Laststop311 - Sunday, May 11, 2014 - link
Well this was a pointless waste of time. We already know how Haswell performs. Should of just copy pasted the specs and linked back to previous haswell reviews. The only interesting thing, the devil's canyon with better TIM, was the only thing not covered.What people want to see is a bunch of DC OC attempts from various sites to see the average max oc and max temp it has and compare that to the 4770k. Everything else in this refresh is meaningless as we have already seen haswell benchmarked. Grats wasting your time, at least u got paid.