USB 3.2 Gen 2 Portable SSDs Roundup - Featuring the Samsung T7 Touch and the SanDisk Extreme Pro
by Ganesh T S on January 23, 2020 9:00 AM ESTPCMark 10 Storage Bench - Real-World Access Traces
There are a number of storage benchmarks that can subject a device to artificial access traces by varying the mix of reads and writes, the access block sizes, and the queue depth / number of outstanding data requests. We saw results from two popular ones - ATTO, and CrystalDiskMark - in a previous section. More serious benchmarks, however, actually replicate access traces from real-world workloads to determine the suitability of a particular device for a particular workload. Real-world access traces may be used for simulating the behavior of computing activities that are limited by storage performance. Examples include booting an operating system or loading a particular game from the disk.
PCMark 10's storage bench (introduced in v2.1.2153) includes four storage benchmarks that use relevant real-world traces from popular applications and common tasks to fully test the performance of the latest modern drives:
- The Full System Drive Benchmark uses a wide-ranging set of real-world traces from popular applications and common tasks to fully test the performance of the fastest modern drives. It involves a total of 204 GB of write traffic.
- The Quick System Drive Benchmark is a shorter test with a smaller set of less demanding real-world traces. It subjects the device to 23 GB of writes.
- The Data Drive Benchmark is designed to test drives that are used for storing files rather than applications. These typically include NAS drives, USB sticks, memory cards, and other external storage devices. The device is subjected to 15 GB of writes.
- The Drive Performance Consistency Test is a long-running and extremely demanding test with a heavy, continuous load for expert users. In-depth reporting shows how the performance of the drive varies under different conditions. This writes more than 23 TB of data to the drive.
Despite the data drive benchmark appearing most suitable for testing direct-attached storage, we opted to run the full system drive benchmark as part of our evaluation flow. Many of us use portable flash drives as boot drives and storage for Steam games. These types of use-cases are addressed only in the full system drive benchmark.
The Full System Drive Benchmark comprises of 23 different traces. For the purpose of presenting results, we classify them under five different categories:
- Boot: Replay of storage access trace recorded while booting Windows 10
- Creative: Replay of storage access traces recorded during the start up and usage of Adobe applications such as Acrobat, After Effects, Illustrator, Premiere Pro, Lightroom, and Photoshop.
- Office: Replay of storage access traces recorded during the usage of Microsoft Office applications such as Excel and Powerpoint.
- Gaming: Replay of storage access traces recorded during the start up of games such as Battlefield V, Call of Duty Black Ops 4, and Overwatch.
- File Transfers: Replay of storage access traces (Write-Only, Read-Write, and Read-Only) recorded during the transfer of data such as ISOs and photographs.
PCMark 10 also generates an overall score, bandwidth, and average latency number for quick comparison of different drives. The sub-sections in the rest of the page reference the access traces specified in the PCMark 10 Technical Guide.
Booting Windows 10
The read-write bandwidth recorded for each drive in the boo access trace is presented below.
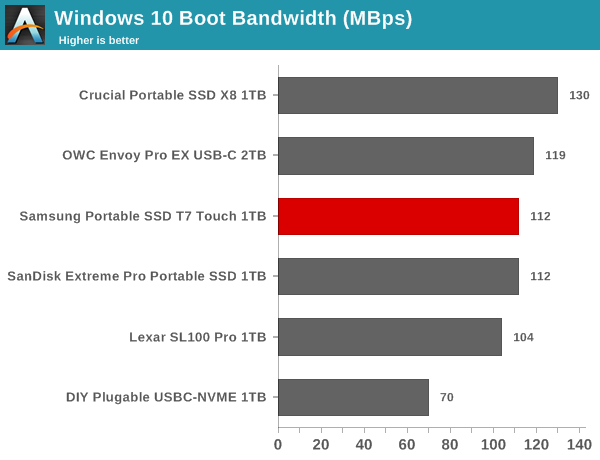
The Crucial X8 appears to be the best of the lot for this workload, while the other new drives are clustered between 104 MBps and 120 MBps. Given the amount of data traffic involved, the gulf is unlikely to result in a major difference in the boot times with various drives.
Creative Workloads
The read-write bandwidth recorded for each drive in the sacr, saft, sill, spre, slig, sps, aft, exc, ill, ind, psh, and psl access traces are presented below.
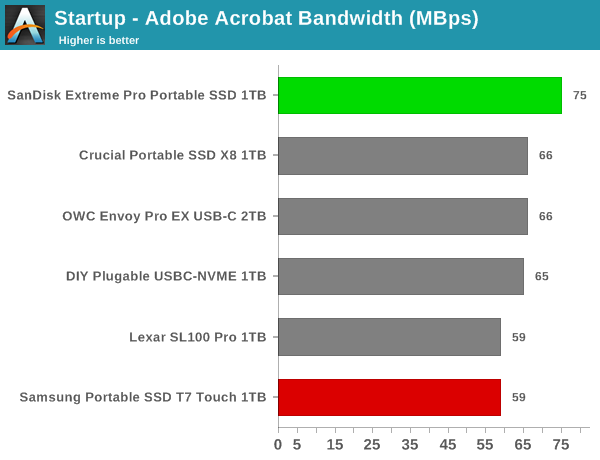
The SanDisk Extreme Pro Portable SSD offers the best startup times overall for different programs used in creative workloads. For usage after startup, the drive is a middling performer, though it comes out on top in a couple of relevant traces. The disappointing aspect is that the T7 Touch doesn't really shine as might be expected.
Office Workloads
The read-write bandwidth recorded for each drive in the exc and pow access traces are presented below.
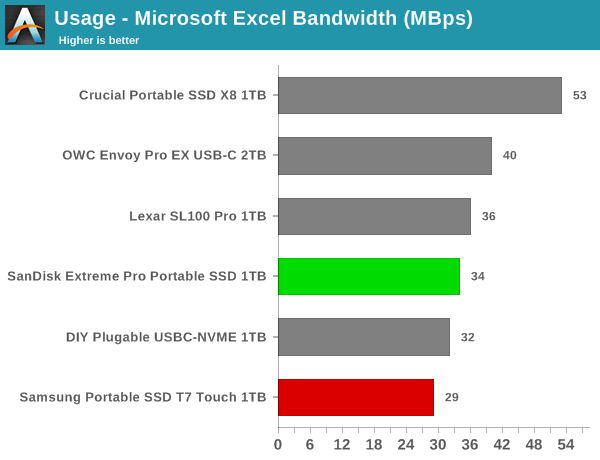
The X8 wins out in the office workloads, with the SanDisk and Samsung units coming in the bottom half of the graph.
Gaming Workloads
The read-write bandwidth recorded for each drive in the bf, cod, and ow access traces are presented below.
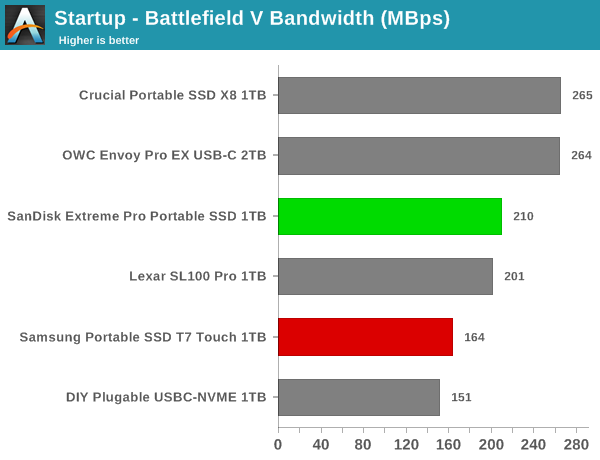
The X8 again wins out here, with the Extreme Pro in the middle of the pack and the T7 Touch in the lower half.
Files Transfer Workloads
The read-write bandwidth recorded for each drive in the cp1, cp2, cp3, cps1, cps2, and cps3 access traces are presented below.
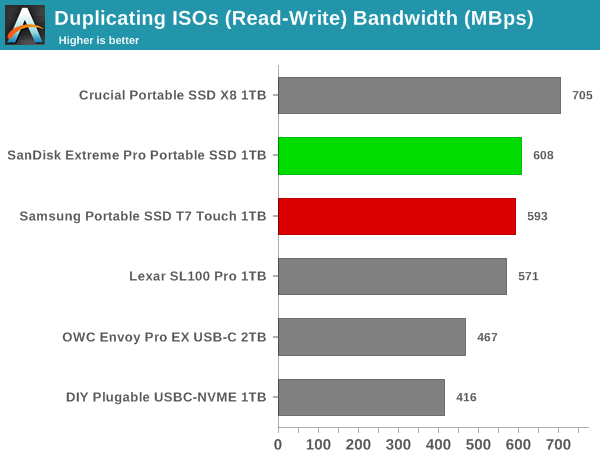
The X8 and the OWC Envoy Pro EX keeps coming on top for the file transfer cases. The Extreme Pro remains in the top half mostly, while the T7 Touch right behind it.
Overall Scores
PCMark 10 reports an overall score based on the observed bandwidth and access times for the full workload set. The score, bandwidth, and average access latency for each of the drives are presented below.
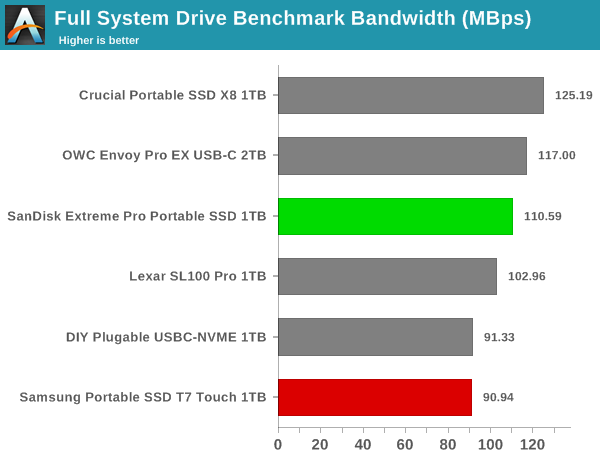
With an overall PCMark 10 full system drive benchmark score of 561, the T7 Touch comes in last among the considered DAS devices. The Extreme Pro scores a more respectable 683, but the Crucial X8 leas the pack with a 765.


38 Comments
View All Comments
13Gigatons - Wednesday, January 29, 2020 - link
I can't believe how stupid their marketing department is...who's naming this stuff?How about: USB 5 and USB 10 and USB 20 and USB 40
regsEx - Thursday, January 30, 2020 - link
There shouldn't be any Gen 1, Gen 1x1, Gen 2, Gen 2x1, SS, SS10, SS20. There should have been only USB 3.0, USB 3.1 and USB 3.2.USB Group does it on purpose. To fool people into new shiny numbers.
regsEx - Thursday, January 30, 2020 - link
There shouldn't be any Gen 1, Gen 1x1, Gen 2, Gen 2x1, Gen 2x2, SS, SS10, SS20*Chrestos SV1GAP - Tuesday, March 10, 2020 - link
The same problem exists with SD cards. After classes 2, 4 ,6, 10 there should be classes 30, 60, 90. Instead of that, there are 3 different names for the class 10 and 2 different names for the classes 6 and 30. https://www.sdcard.org/developers/overview/speed_c...Eliadbu - Tuesday, January 28, 2020 - link
By the drive speeds I guess it's USB 3.2 gen 2x1 and not gen 2x2 (thanks for the simple naming scheme USB-IF) also makes wonder why there is around 15-20% overhead of the maximum connection speed ( I know it exits in other connections like SATA for example but I wonder why it is so high)amnesia0287 - Thursday, April 9, 2020 - link
They all seemed to use the same usb chip, so probably that is it’s max speed.Leo222 - Wednesday, March 4, 2020 - link
Interested in the topic, decided to read, found the first site: https://www.bestadvisor.com/external-solid-state-d...And here they write: However, the WD My Passport SSD is uniquely compatible with pretty much all generations of computers. Since it uses the USB 3.1 Gen-2 interface
It's like the media is truth mixed with fiction, I think it was invented only in order to attract attention and money
Chrestos SV1GAP - Tuesday, March 10, 2020 - link
@ Author, Ganesh T SPage 6: "USB 2.0 ports are guaranteed to deliver only 4.5W (900mA @ 5V)".
You mean "USB 3.0".