The AMD 2nd Gen Ryzen Deep Dive: The 2700X, 2700, 2600X, and 2600 Tested
by Ian Cutress on April 19, 2018 9:00 AM ESTImprovements to the Cache Hierarchy
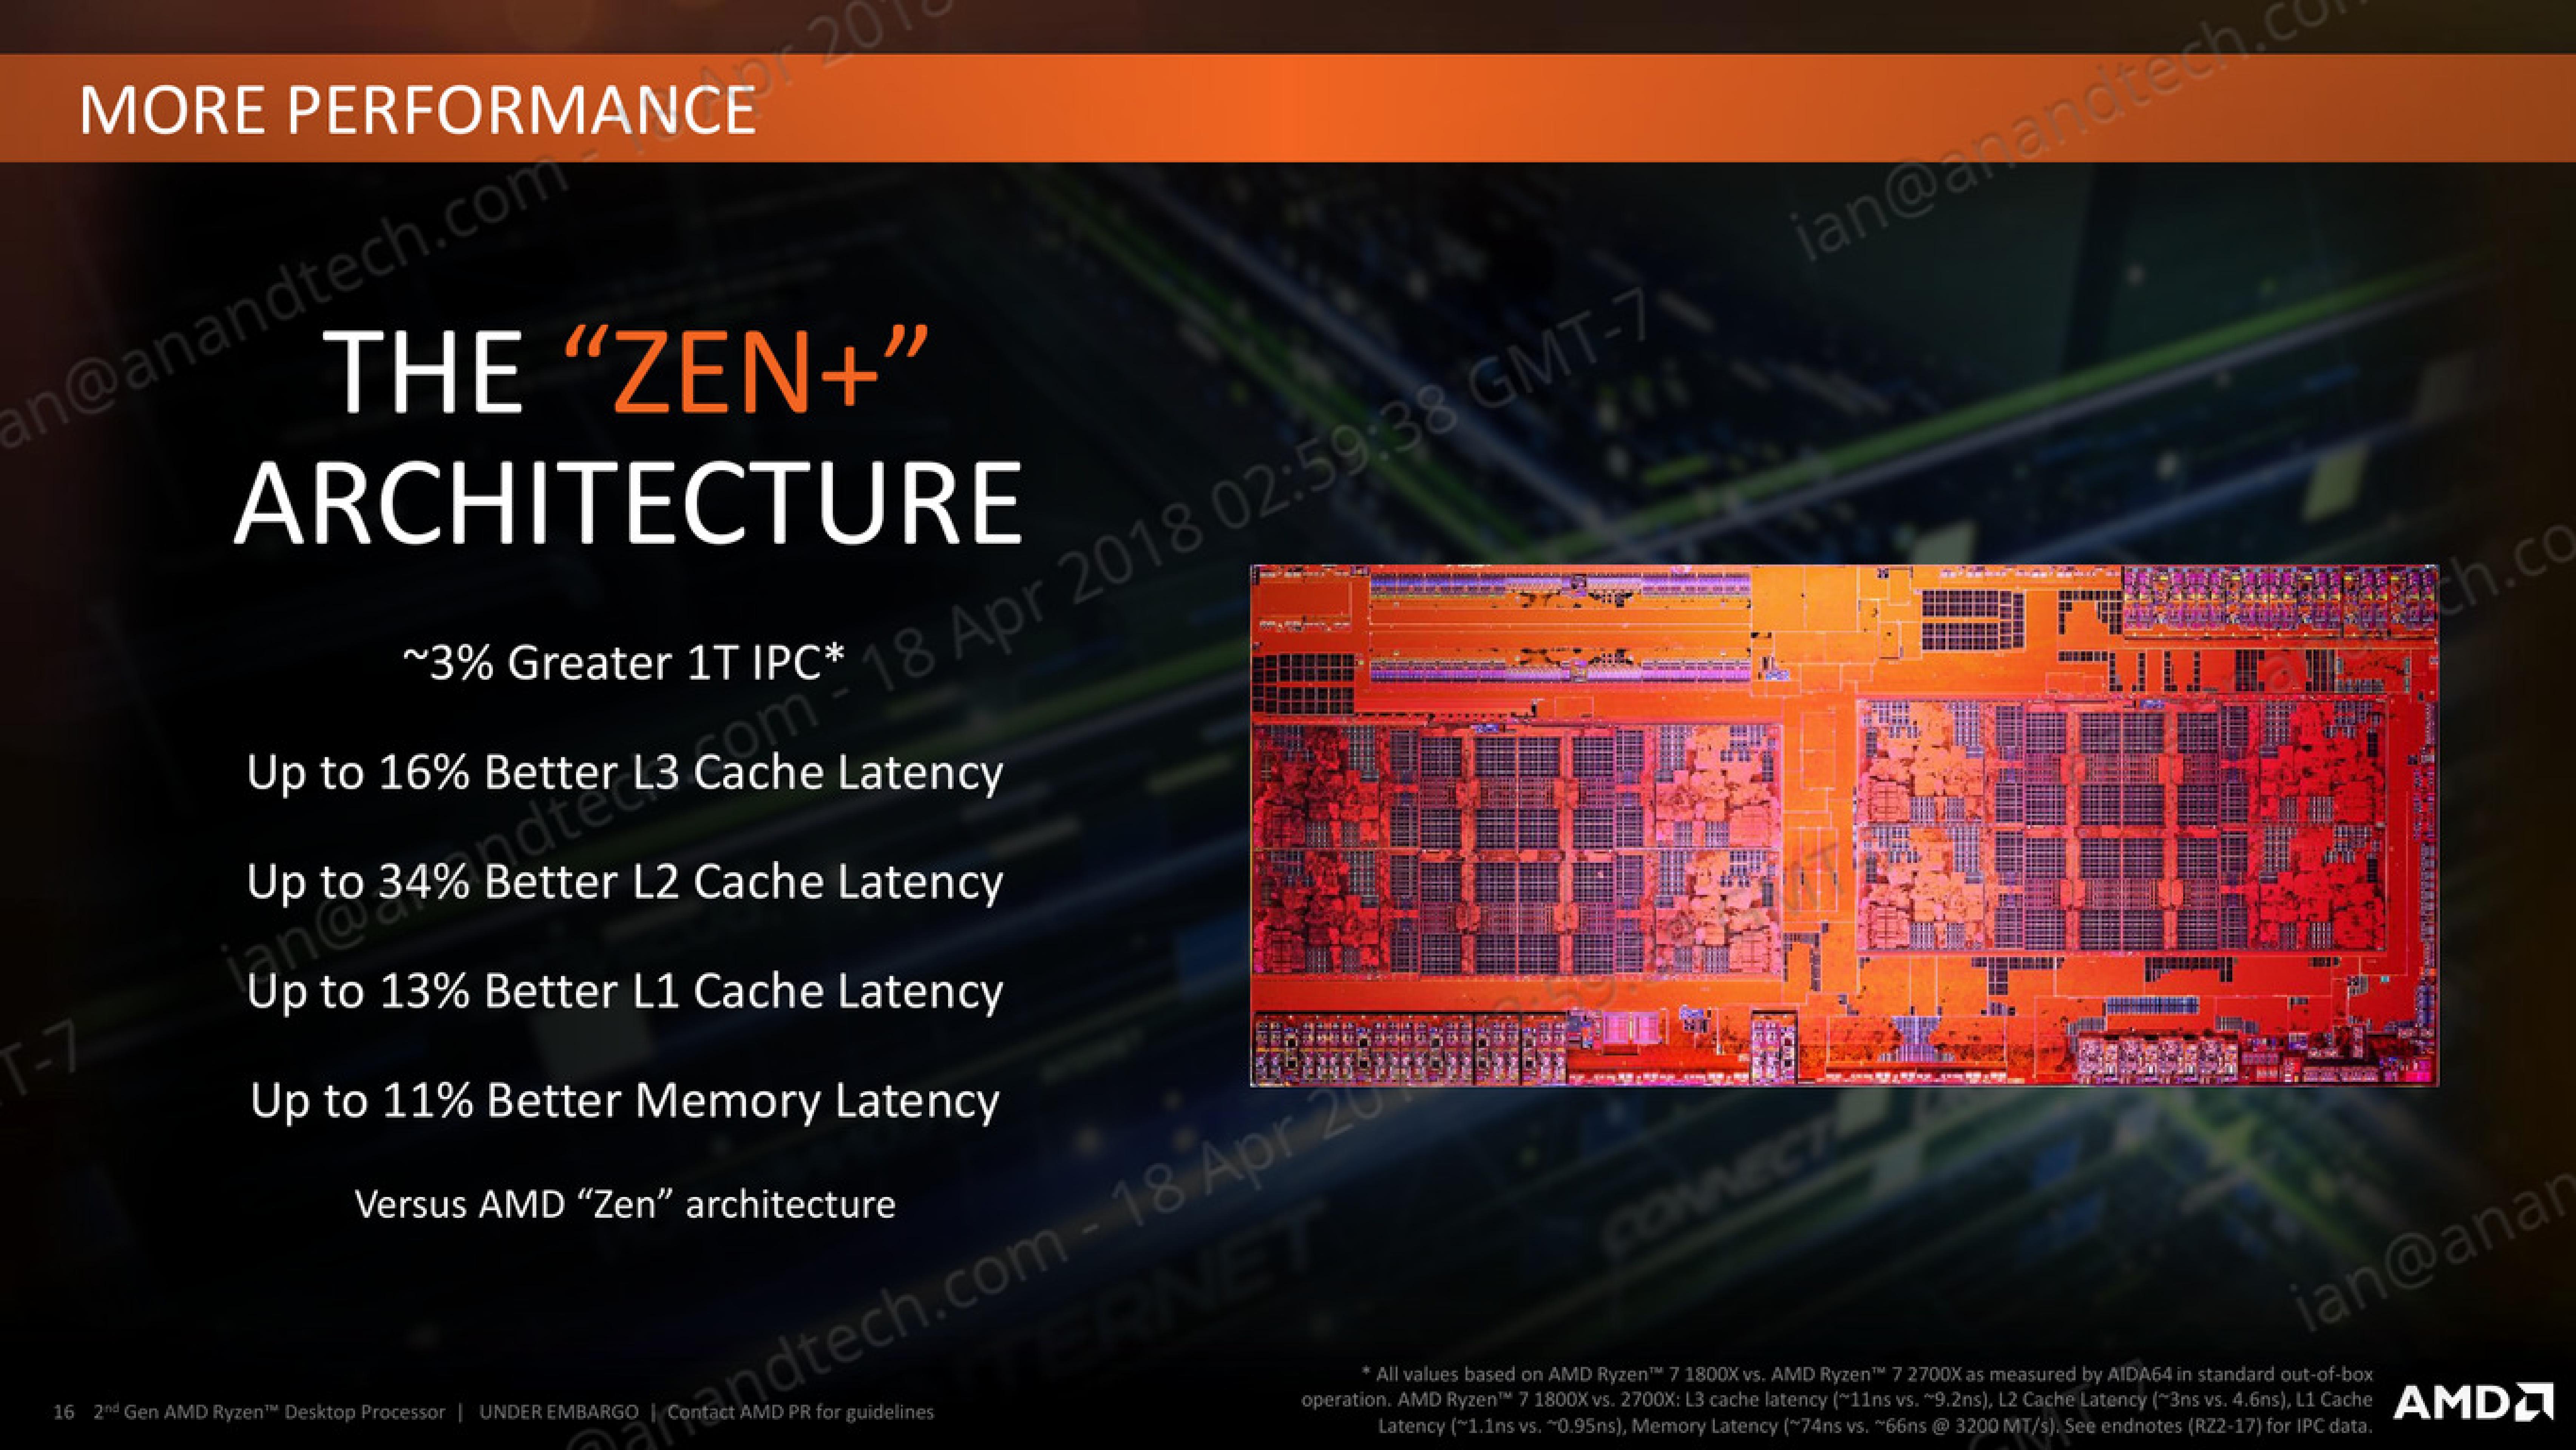
The biggest under-the-hood change for the Ryzen 2000-series processors is in the cache latency. AMD is claiming that they were able to knock one-cycle from L1 and L2 caches, several cycles from L3, and better DRAM performance. Because pure core IPC is intimately intertwined with the caches (the size, the latency, the bandwidth), these new numbers are leading AMD to claim that these new processors can offer a +3% IPC gain over the previous generation.
The numbers AMD gives are:
- 13% Better L1 Latency (1.10ns vs 0.95ns)
- 34% Better L2 Latency (4.6ns vs 3.0ns)
- 16% Better L3 Latency (11.0ns vs 9.2ns)
- 11% Better Memory Latency (74ns vs 66ns at DDR4-3200)
- Increased DRAM Frequency Support (DDR4-2666 vs DDR4-2933)
It is interesting that in the official slide deck AMD quotes latency measured as time, although in private conversations in our briefing it was discussed in terms of clock cycles. Ultimately latency measured as time can take advantage of other internal enhancements; however a pure engineer prefers to discuss clock cycles.
Naturally we went ahead to test the two aspects of this equation: are the cache metrics actually lower, and do we get an IPC uplift?
Cache Me Ousside, How Bow Dah?
For our testing, we use a memory latency checker over the stride range of the cache hierarchy of a single core. For this test we used the following:
- Ryzen 7 2700X (Zen+)
- Ryzen 5 2400G (Zen APU)
- Ryzen 7 1800X (Zen)
- Intel Core i7-8700K (Coffee Lake)
- Intel Core i7-7700K (Kaby Lake)
The most obvious comparison is between the AMD processors. Here we have the Ryzen 7 1800X from the initial launch, the Ryzen 5 2400G APU that pairs Zen cores with Vega graphics, and the new Ryzen 7 2700X processor.
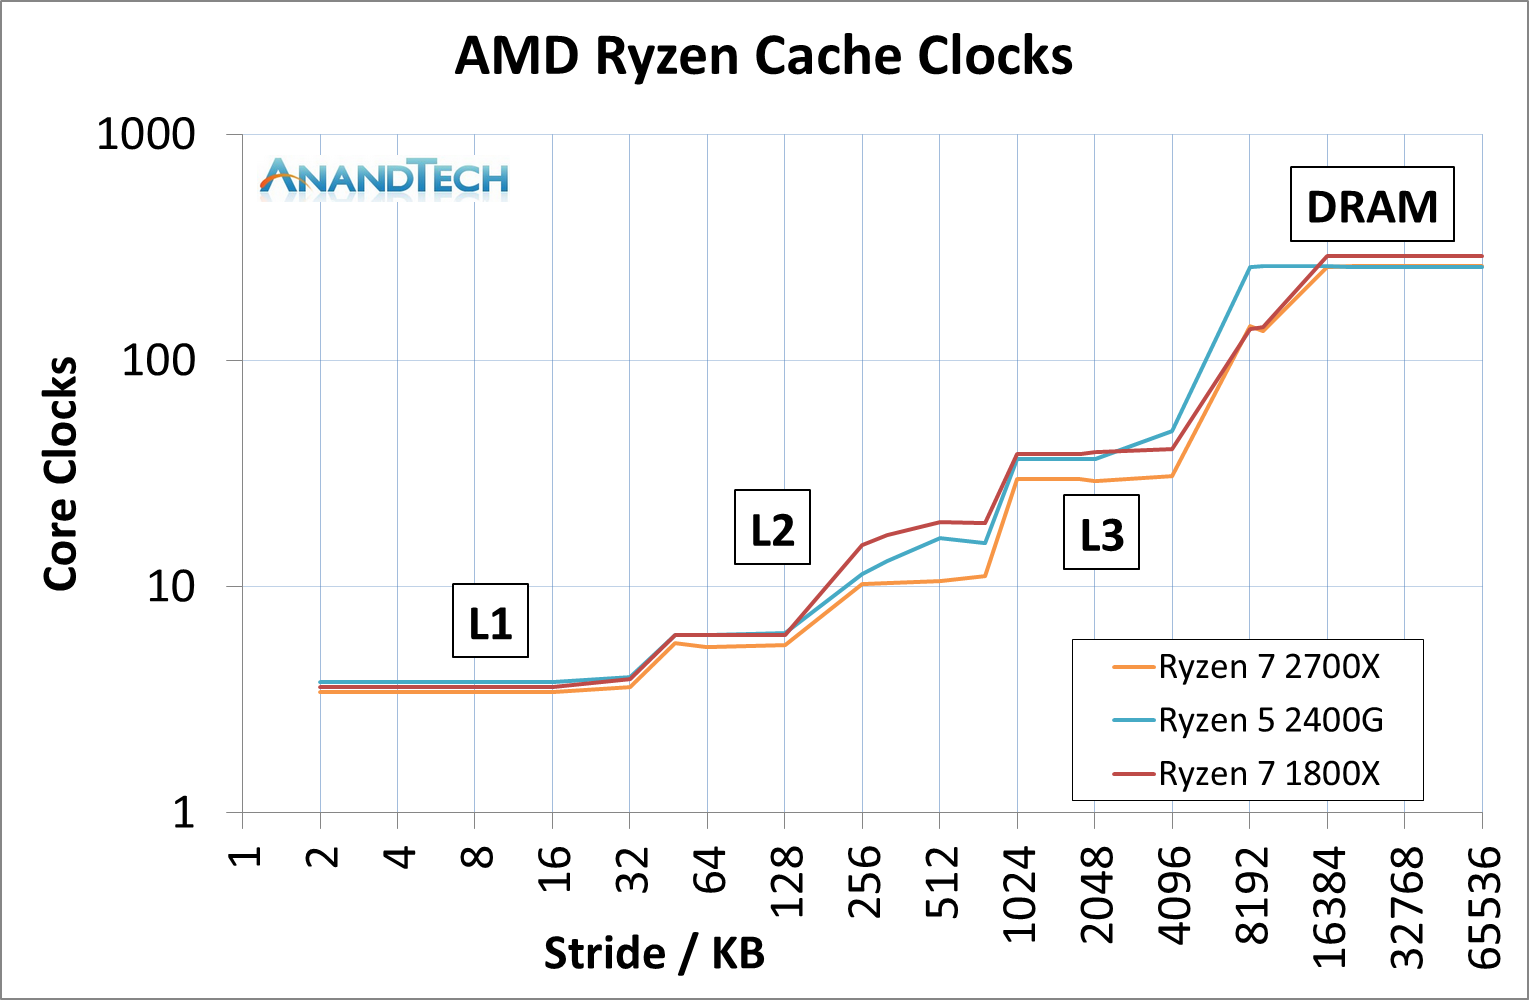
This graph is logarithmic in both axes.
This graph shows that in every phase of the cache design, the newest Ryzen 7 2700X requires fewer core clocks. The biggest difference is on the L2 cache latency, but L3 has a sizeable gain as well. The reason that the L2 gain is so large, especially between the 1800X and 2700X, is an interesting story.
When AMD first launched the Ryzen 7 1800X, the L2 latency was tested and listed at 17 clocks. This was a little high – it turns out that the engineers had intended for the L2 latency to be 12 clocks initially, but run out of time to tune the firmware and layout before sending the design off to be manufactured, leaving 17 cycles as the best compromise based on what the design was capable of and did not cause issues. With Threadripper and the Ryzen APUs, AMD tweaked the design enough to hit an L2 latency of 12 cycles, which was not specifically promoted at the time despite the benefits it provides. Now with the Ryzen 2000-series, AMD has reduced it down further to 11 cycles. We were told that this was due to both the new manufacturing process but also additional tweaks made to ensure signal coherency. In our testing, we actually saw an average L2 latency of 10.4 cycles, down from 16.9 cycles in on the Ryzen 7 1800X.
The L3 difference is a little unexpected: AMD stated a 16% better latency: 11.0 ns to 9.2 ns. We saw a change from 10.7 ns to 8.1 ns, which was a drop from 39 cycles to 30 cycles.
Of course, we could not go without comparing AMD to Intel. This is where it got very interesting. Now the cache configurations between the Ryzen 7 2700X and Core i7-8700K are different:
| CPU Cache uArch Comparison | ||
| AMD Zen (Ryzen 1000) Zen+ (Ryzen 2000) |
Intel Kaby Lake (Core 7000) Coffee Lake (Core 8000) |
|
| L1-I Size | 64 KB/core | 32 KB/core |
| L1-I Assoc | 4-way | 8-way |
| L1-D Size | 32 KB/core | 32 KB/core |
| L1-D Assoc | 8-way | 8-way |
| L2 Size | 512 KB/core | 256 KB/core |
| L2 Assoc | 8-way | 4-way |
| L3 Size | 8 MB/CCX (2 MB/core) |
2 MB/core |
| L3 Assoc | 16-way | 16-way |
| L3 Type | Victim | Write-back |
AMD has a larger L2 cache, however the AMD L3 cache is a non-inclusive victim cache, which means it cannot be pre-fetched into unlike the Intel L3 cache.
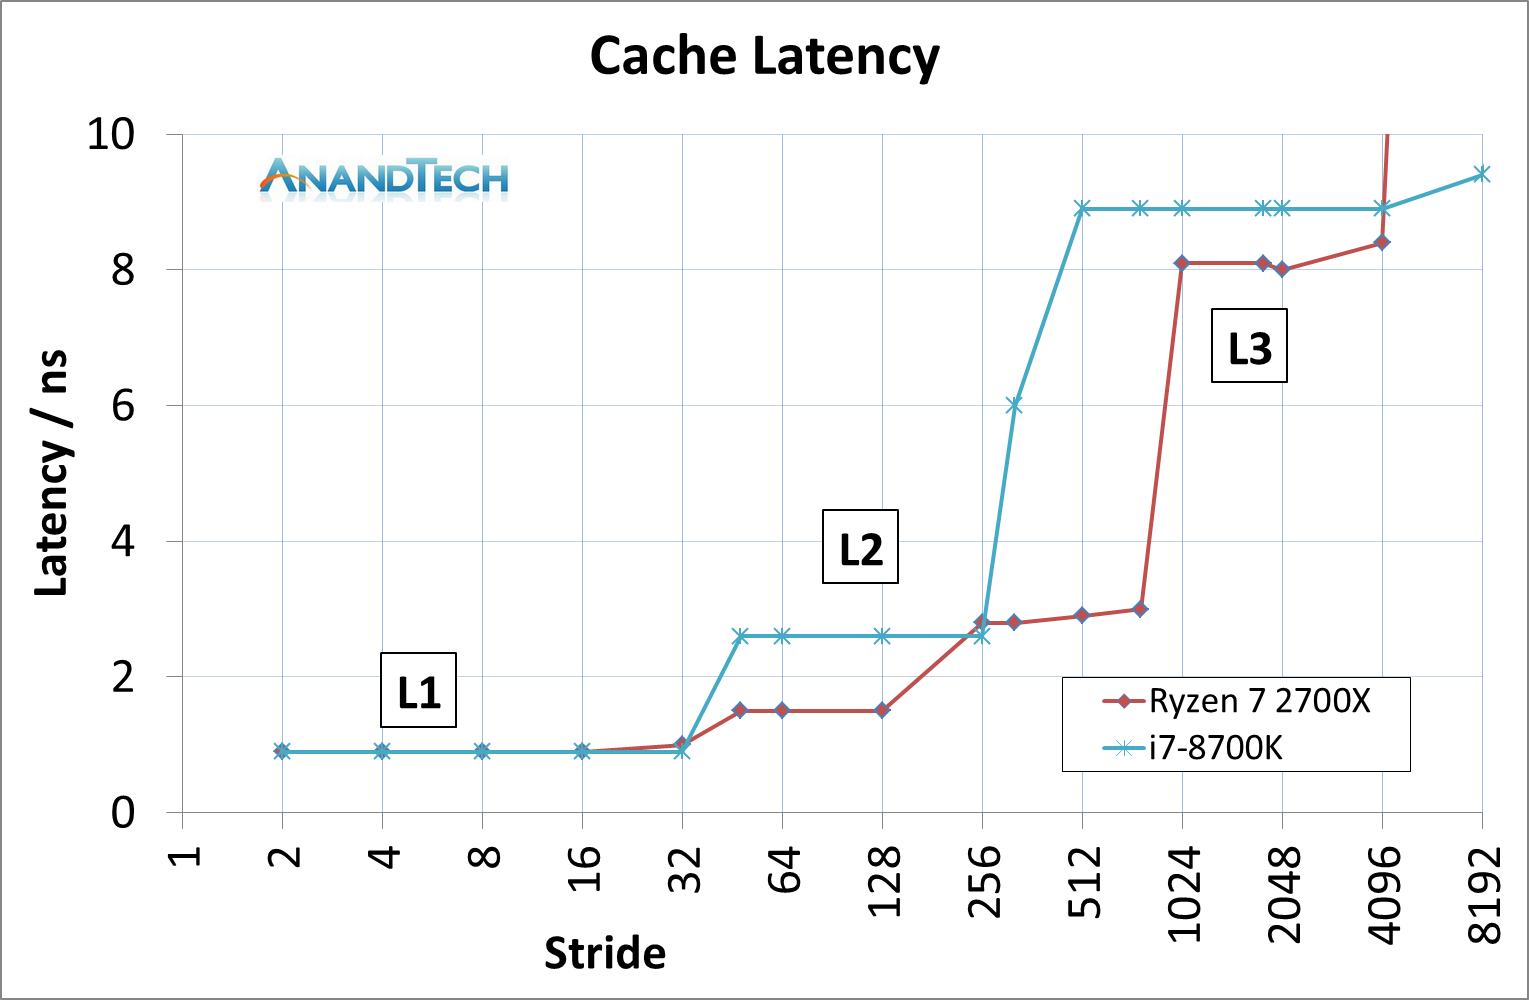
This was an unexpected result, but we can see clearly that AMD has a latency timing advantage across the L2 and L3 caches. There is a sizable difference in DRAM, however the core performance metrics are here in the lower caches.
We can expand this out to include the three AMD chips, as well as Intel’s Coffee Lake and Kaby Lake cores.

This is a graph using cycles rather than timing latency: Intel has a small L1 advantage, however the larger L2 caches in AMD’s Zen designs mean that Intel has to hit the higher latency L3 earlier. Intel makes quick work of DRAM cycle latency however.


545 Comments
View All Comments
Flying Aardvark - Monday, April 23, 2018 - link
There's usually a lag from 6-12 months on any change that's already in place. Any topic really. Humans aren't very good at seeing what's in front of them. It requires enough people repeating it over and over around them, until they accept reality.Before that reassurance from society around them, they don't have the confidence to see/admit reality. Just something I've noticed. :)
mapesdhs - Monday, May 14, 2018 - link
That's why I like Goodkind's "1st Rule": people will believe a lie either because they want to believe it's true, or they're afraid it's true.Kaihekoa - Tuesday, April 24, 2018 - link
I don't know what reviews you read, but the WCCF review shows slight favor to 8700K in gaming. However, it's an incomplete review of gaming as they only test at 1440p Ultra, where the GPU bears most of the workload, and only show average framerate. Tech Report doesn't even go into any detail whatsoever on gaming and only broaches the topic in a couple paragraphs on the conclusion page. Still, they even show a lead to Intel. Anandtech shows the 2700X leading every game in framerate, which is flat out inaccurate when compared to other reviews.The Spectre BS has marginal, if any, impact on game performance. I don't know how you get the idea that CPU IO is related to loading textures in a game when textures are loaded into VRAM by the GPU. Looking further into the test setup, Anand uses slower RAM on Intel platforms, an ECC mobo for Z170, doesn't disclose GPU driver versions and uses an enterprise OS on consumer hardware. I'm guessing these and/or other factors contributed to the inaccurate numbers, relative to other reviewers, causing me to lose a lot of respect for this once well-regarded hardware reviewer. I'll get my benchmark numbers from PC Perspective and Gamers Nexus instead.
Not hating on AMD, and I even own stock in both AMD and Intel. They offer tremendous value at their price points, but I spend alot of money on my PC and use it for gaming, overclocking/benching, and basic tasks, which all seem better suited to Intel's IPC/clock speed advantage. I need reviews to post accurate numbers so that I can make my upgrade decisions, and this incomplete review with numbers not reflective of actual gaming performance fails to meet that need.
Flying Aardvark - Tuesday, April 24, 2018 - link
Come on man. I almost stop responding to replies like this. WCCF benches the base 2700, of course the 8700K wins, they don't include the 2700X. Again, the results line up with AT's. I wrote TR but meant TechRadar.Eh, I'm not going to keep going on addressing all these "points". IO is a syscall, reading/writing to disk is a syscall and that's where Intel takes up to a 50% perf hit with their Spectre v3 patches in place. This is known, and been known for months on the impact for games that do lots of texture steaming like ROTR. I even provided user provided evidence, that beat Anandtech here to the punch by 3 months.
Anand used Intel/AMD memory spec. That's what you're supposed to do when testing a product advertised to use certain components (for good reason, BTW, stupid gamer kids discounted).
Bottom line is that you and people flipping out just like you are wrong. I already knew about this being under the surface months ago. Now that it's impossible to cover it up with the 2000 series launch, more people are simply aware that AMD has taken over.
GreenMeters - Tuesday, April 24, 2018 - link
But Anandtech has the 2700, and even the 2600X and 2600, beating the 8700K. So how are the WCCF benchmarks lining up with Anandtech's?Maxiking - Tuesday, April 24, 2018 - link
"I just finished running Rise of the Tomb Raider benchmarks, 1080p, very high preset, FXAA.Unpatched:
Mountain Peak: 131.48 FPS (min: 81.19 max: 197.02)
Syria: 101.99 FPS (min: 62.73, max: 122.24)
Geothermal Valley: 98.93 FPS (min:76.48, max: 117.00)
Overall score: 111.31 FPS
Windows patch only:
Mountain Peak: 135.34 FPS (min: 38.21 max: 212.84)
Syria: 102.54 FPS (min: 44.22, max: 144.03)
Geothermal Valley: 96.36 FPS (min:41.35, max: 148.46)
Overall score: 111.93 FPS
Windows patch and BIOS update:
Mountain Peak: 134.01 FPS (min: 59.91 max: 216.16)
Syria: 101.68 FPS (min: 38.95, max: 143.44)
Geothermal Valley: 97.55 FPS (min:46.18, max: 143.97)
Overall score: 111.62 FPS
Average framerates don't seem affected."
From the link you posted, you got rekt by yourself.
Maxiking - Tuesday, April 24, 2018 - link
Actually, I can't bother waiting because, it's futile.The benchmark from that thread shows there has been no noticable performance regression after the updates had been applied.
I know what you gonna do. Look at those min fps. I WAS RIGHT. I WAS RIGHT. You are thinking right now. No, you weren't. If you ever had run TOR benchmarks, you would have experienced it. There are quite severe discrepancies in the inbuilt benchmark when comes to min/max fps. I noticed it myself when I was overclocking 6700k and running game benchmarks, stability tests. Since you are mostly using anecdotal evidence, you do not know how to make proper arguments, don't provide valid sources, we are really limited here, but that's what we have.
To support my statement, here is the video:
https://www.youtube.com/watch?v=BZEhkcs9hpU
It is not mine, but it is proving my point, there is an issue in the benchmark. It shows wrong/misleading min/max fps pretty often which other benchmarking solutions doesn't record.
The video was published on 7 Jul 2016, so no meltdown/spectre for you. I know you will argue it is no coincidence with those min fps, but look at the max as well.
Maxiking - Tuesday, April 24, 2018 - link
*solutionFlying Aardvark - Wednesday, April 25, 2018 - link
Are you retarded? I know you are because I ran those benchmarks myself and it's reproducible on more games than ROTR. Where's your contradicting information to back your claim, you do know that trying to poke holes in info is not an argument.Ranger1065 - Wednesday, April 25, 2018 - link
So sad the review failed to meet your expectations. Enjoy your time at Gamer's Nexus (cough).