Launching the #CPUOverload Project: Testing Every x86 Desktop Processor since 2010
by Dr. Ian Cutress on July 20, 2020 1:30 PM ESTCPU Tests: Science
In this version of our test suite, all the science focused tests that aren’t ‘simulation’ work are now in our science section. This includes Brownian Motion, calculating digits of Pi, molecular dynamics, and for the first time, we’re trialing an artificial intelligence benchmark, both inference and training, that works under Windows using python and TensorFlow. Where possible these benchmarks have been optimized with the latest in vector instructions, except for the AI test – we were told that while it uses Intel’s Math Kernel Libraries, they’re optimized more for Linux than for Windows, and so it gives an interesting result when unoptimized software is used.
3D Particle Movement v2.1: Non-AVX and AVX2/AVX512
This is the latest version of the benchmark designed to simulate semi-optimized scientific algorithms taken directly from my doctorate thesis. This involves randomly moving particles in a 3D space using a set of algorithms that define random movement. Version 2.1 improves over 2.0 by passing the main particle structs by reference rather than by value, and decreasing the amount of double->float->double recasts the compiler was adding in.
The initial version of v2.1 is a custom C++ binary of my own code, flags are in place to allow for multiple loops of the code with a custom benchmark length. By default this version runs six times and outputs the average score to the console, which we capture with a redirection operator that writes to file.

For v2.1, we also have a fully optimized AVX2/AVX512 version, which uses intrinsics to get the best performance out of the software. This was done by a former Intel AVX-512 engineer who now works elsewhere. According to Jim Keller, there are only a couple dozen or so people who understand how to extract the best performance out of a CPU, and this guy is one of them. To keep things honest, AMD also has a copy of the code, but has not proposed any changes.
The final result is a table that looks like this:
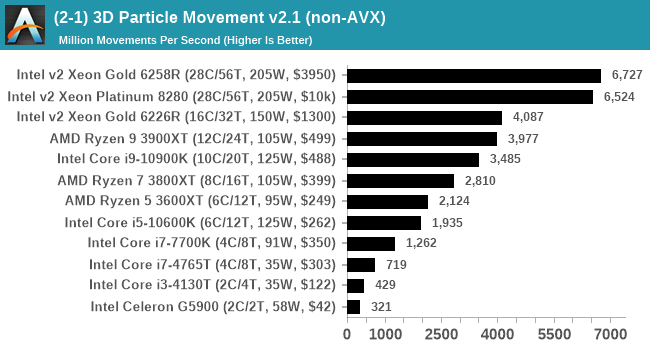
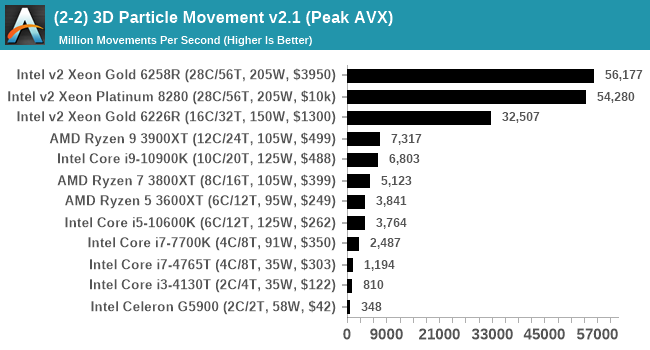
The 3DPM test is set to output millions of movements per second, rather than time to complete a fixed number of movements. This way the data represented becomes a linear when performance scales and easier to read as a result.
y-Cruncher 0.78.9506: www.numberworld.org/y-cruncher
If you ask anyone what sort of computer holds the world record for calculating the most digits of pi, I can guarantee that a good portion of those answers might point to some colossus super computer built into a mountain by a super-villain. Fortunately nothing could be further from the truth – the computer with the record is a quad socket Ivy Bridge server with 300 TB of storage. The software that was run to get that was y-cruncher.
Built by Alex Yee over the last part of a decade and some more, y-Cruncher is the software of choice for calculating billions and trillions of digits of the most popular mathematical constants. The software has held the world record for Pi since August 2010, and has broken the record a total of 7 times since. It also holds records for e, the Golden Ratio, and others. According to Alex, the program runs around 500,000 lines of code, and he has multiple binaries each optimized for different families of processors, such as Zen, Ice Lake, Sky Lake, all the way back to Nehalem, using the latest SSE/AVX2/AVX512 instructions where they fit in, and then further optimized for how each core is built.
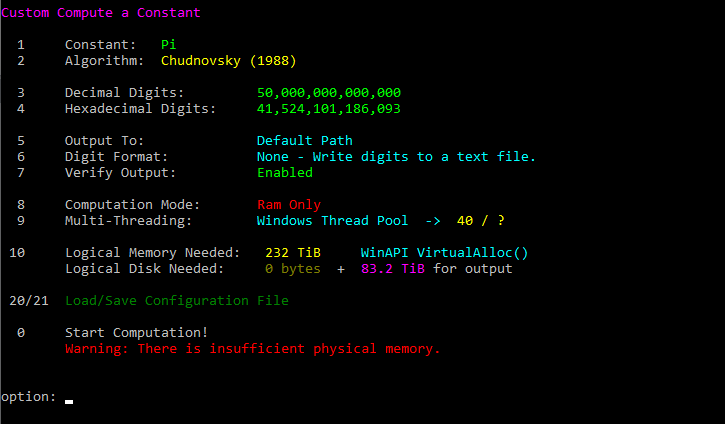
For our purposes, we’re calculating Pi, as it is more compute bound than memory bound. In single thread mode we calculate 250 million digits, while in multithreaded mode we go for 2.5 billion digits. That 2.5 billion digit value requires ~12 GB of DRAM, so for systems that do not have that much, we also have a separate table for slower CPUs and 250 million digits.
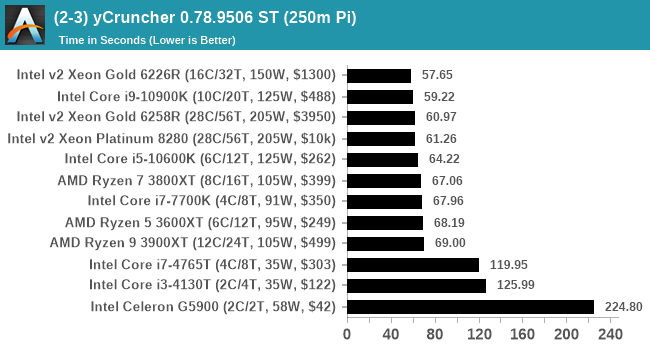
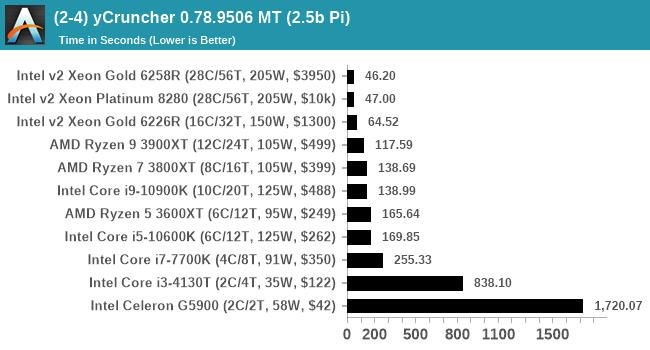
y-Cruncher is also affected by memory bandwidth, even in ST mode, which is why we're seeing the Xeons score very highly despite the lower single thread frequency.
Personally I have held a few of the records that y-Cruncher keeps track of, and my latest attempt at a record was to compute 600 billion digits of the Euler-Mascheroni constant, using a Xeon 8280 and 768 GB of DRAM. It took over 100 days (!).
NAMD 2.13 (ApoA1): Molecular Dynamics
One of the popular science fields is modelling the dynamics of proteins. By looking at how the energy of active sites within a large protein structure over time, scientists behind the research can calculate required activation energies for potential interactions. This becomes very important in drug discovery. Molecular dynamics also plays a large role in protein folding, and in understanding what happens when proteins misfold, and what can be done to prevent it. Two of the most popular molecular dynamics packages in use today are NAMD and GROMACS.
NAMD, or Nanoscale Molecular Dynamics, has already been used in extensive Coronavirus research on the Frontier supercomputer. Typical simulations using the package are measured in how many nanoseconds per day can be calculated with the given hardware, and the ApoA1 protein (92,224 atoms) has been the standard model for molecular dynamics simulation.
Luckily the compute can home in on a typical ‘nanoseconds-per-day’ rate after only 60 seconds of simulation, however we stretch that out to 10 minutes to take a more sustained value, as by that time most turbo limits should be surpassed. The simulation itself works with 2 femtosecond timesteps.
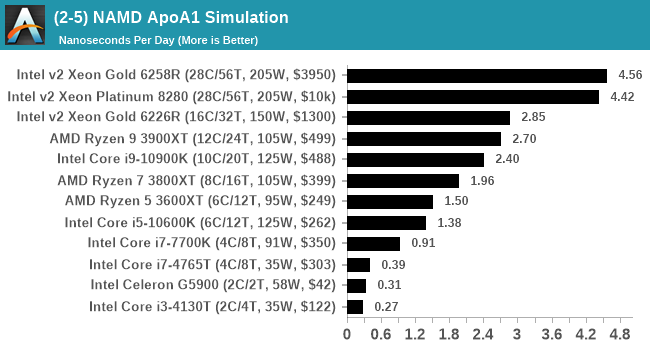
How NAMD is going to scale in our testing is going to be interesting, as the software has been developed to go across large supercomputers while taking advantage of fast communications and MPI.
AI Benchmark 0.1.2 using TensorFlow: Link
Finding an appropriate artificial intelligence benchmark for Windows has been a holy grail of mine for quite a while. The problem is that AI is such a fast moving, fast paced word that whatever I compute this quarter will no longer be relevant in the next, and one of the key metrics in this benchmarking suite is being able to keep data over a long period of time. We’ve had AI benchmarks on smartphones for a while, given that smartphones are a better target for AI workloads, but it also makes some sense that everything on PC is geared towards Linux as well.
Thankfully however, the good folks over at ETH Zurich in Switzerland have converted their smartphone AI benchmark into something that’s useable in Windows. It uses TensorFlow, and for our benchmark purposes we’ve locked our testing down to TensorFlow 2.10, AI Benchmark 0.1.2, while using Python 3.7.6 – this was the only combination of versions we could get to work, because Python 3.8 has some quirks.

The benchmark runs through 19 different networks including MobileNet-V2, ResNet-V2, VGG-19 Super-Res, NVIDIA-SPADE, PSPNet, DeepLab, Pixel-RNN, and GNMT-Translation. All the tests probe both the inference and the training at various input sizes and batch sizes, except the translation that only does inference. It measures the time taken to do a given amount of work, and spits out a value at the end.
There is one big caveat for all of this, however. Speaking with the folks over at ETH, they use Intel’s Math Kernel Libraries (MKL) for Windows, and they’re seeing some incredible drawbacks. I was told that MKL for Windows doesn’t play well with multiple threads, and as a result any Windows results are going to perform a lot worse than Linux results. On top of that, after a given number of threads (~16), MKL kind of gives up and performance drops of quite substantially.
So why test it at all? Firstly, because we need an AI benchmark, and a bad one is still better than not having one at all. Secondly, if MKL on Windows is the problem, then by publicizing the test, it might just put a boot somewhere for MKL to get fixed. To that end, we’ll stay with the benchmark as long as it remains feasible.
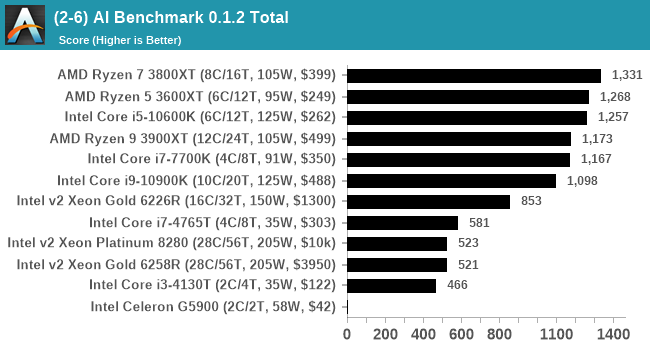
As you can see, we’re already seeing it perform really badly with the big chips. Somewhere around the Ryzen 7 is probably where the peak is. Our Xeon chips didn't really work at all.


110 Comments
View All Comments
vasily - Monday, July 20, 2020 - link
You might want to check out Phoronix Test Suite and openbenchmarking.org.https://www.phoronix-test-suite.com/
https://openbenchmarking.org/
colinisation - Monday, July 20, 2020 - link
would love to see the following processors added5775C (overclocked to 4Ghz) - just purely to see what impact the eDRAM has on workloads
4770K
7600K
Phenom II X4
Highest Bulldozer core
VIA's highest performance x86 core
faizoff - Monday, July 20, 2020 - link
What a gargantuan project this is going to be. And I cannot wait, oddly enough I've been using the bench tool the past few weeks to get a sense of how much difference an upgrade for me would make.I am probably one of the many (or few) people that have still held on to their i5 2500k and this is one of the places I can select that CPU and compare the benchmarks with newer releases.
This project looks to be an amazing read once all done and will be especially looking forward to those segments "how well does x CPU run today?"
Alim345 - Monday, July 20, 2020 - link
Are you going to make benchmark scripts available? They should be useful for individual comparisons, since many users might have overclocked CPUs which were more common in 2010-2015.brantron - Monday, July 20, 2020 - link
Just to fill out the starting set:7700K needs a common AMD counterpart, i.e. Ryzen 2600
Sandy or Ivy Bridge i7
Haswell i7
That would also make for a good article, as it should be possible to overclock any of those to ~4.5 GHz for a more apples to apples comparison.
StormyParis - Monday, July 20, 2020 - link
Thank you for that. My main question is not "what should I buy" because that's always very well covered, and on a fixed budget there's never much choice anyway, but "should I upgrade *now* which is only worth it when last time's amount of money gets you at least 2x performance. I'ive got a 7yo Core i5... I'll look into it !eastcoast_pete - Monday, July 20, 2020 - link
Ian, thanks for this!One aspect I've wondered about for a while is whether you could include performance/Watt in your tests and comparisons going forward? I know that's usually done for server CPUs, but I also find it of interest for desktop and laptop CPUs.
thebigteam - Monday, July 20, 2020 - link
I think I have the below list of Intel CPUs available if needed, likely with working mobos too. Would be very happy to clean out the closet and get these to you guys :) Likely some 2009/2010 Athlons as wellE8400
i3 530
i3 540
i5 760
i5 2500
i5 4670K
inighthawki - Monday, July 20, 2020 - link
Thank you so much for changing your gaming benchmark methodology. I tend to play my games at 1440p on lowest settings for maximum framerates, which is far more often than not CPU bound. It was always so annoying seeing the benchmarks be GPU bound when I'm trying to see how much a new CPU helps.Smell This - Monday, July 20, 2020 - link
Chicken(lol)
With AM3, AM2+ and AM2 processors, AM3+ processors broke backwards-compatibility.
A mobo like the MSI 790FX K9A2 Platinum transitioned nearly 250 processors from S754-939, to AM2-AM3, beginning with the single-core Athlon 64 3000+ 'Orleans' up to the PhII x6 DDR3 Thubans.
These were the progeny of the K8 or 'Hammer' projects. A Real Man would never leave them behind ...
https://www.cpu-upgrade.com/mb-MSI/K9A2_Platinum_%...