GIGABYTE BRIX Pro: A First Look at the Intel i7-4770R with Iris Pro HD 5200
by Ganesh T S on January 7, 2014 8:00 PM EST
Gigabyte is targeting the BRIX Pro towards professional consumers with compute-intensive workloads. For general office use (including web browsing and light word processing work), systems such as the Core i5-based NUC we reviewed last week are more than enough. In order to bring out scenarios where the extra grunt provided by the Pro unit becomes necessary, we are presenting some real world benchmarks below. These are tasks carried out by workers where time in money, and the premium paid upfront for the better configuration is trivial compared to the time saved.
WinRAR Benchmark
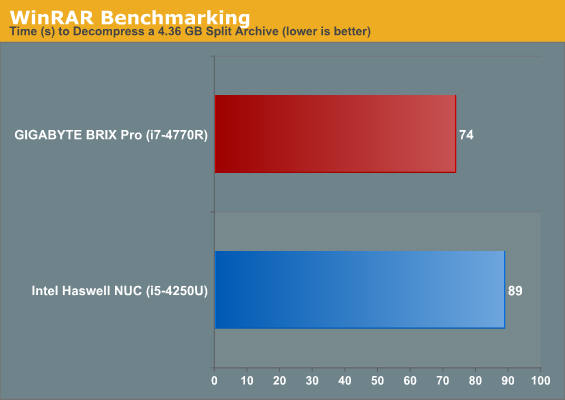
We present two benchmarks using WinRAR. The first one involves decompressing a 4.36 GB split archive and recording the time taken to complete the process. This is a test of the CPU power as well as the storage subsystem.
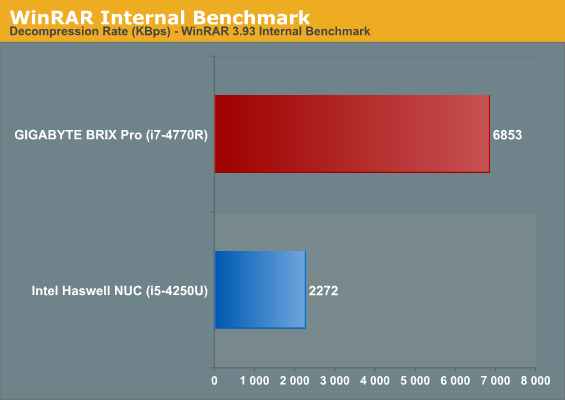
The graph below presents the internal WinRAR benchmark numbers. In this benchmark, the program takes compresses / decompresses random data in the RAM. This is a test of the CPU power as well as the DRAM capabilities.
TrueCrypt Benchmark
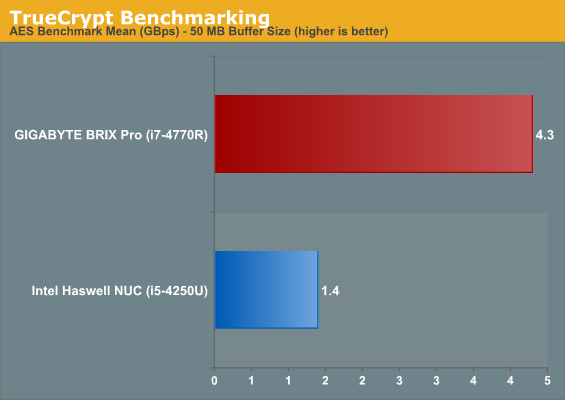
As businesses (and even home consumers) become more security conscious, the importance of encryption can't be overstated. CPUs supporting the AES-NI instruction for accelerating the encryption and decryption processes have, till now, been the higher end SKUs. However, with Bay Trail, even the lowly Atom series has gained support for AES-NI. Both the i5-4250U and the i7-4770R have AES-NI instructions support. The TrueCrypt internal benchmark provides some interesting cryptography-related numbers to ponder. In the graph below, we can get an idea of how fast a TrueCrypt volume would behave in the two different systems.
Agisoft PhotoScan
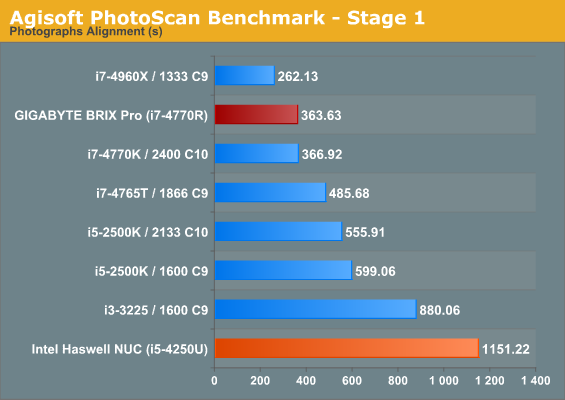
Agisoft PhotoScan is a commercial program that converts 2D images into 3D point maps, meshes and textures. The program designers sent us a command line version in order to evaluate the efficiency of various systems that go under our review scanner. The command line version has two benchmark modes, one using the CPU and the other using both the CPU and GPU (via OpenCL). The benchmark takes around 50 photographs and does four stages of computation:
Stage 1: Align Photographs
Stage 2: Build Point Cloud (capable of OpenCL acceleration)
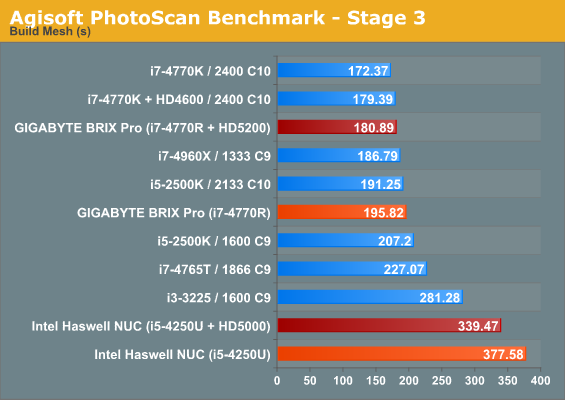
Stage 3: Build Mesh
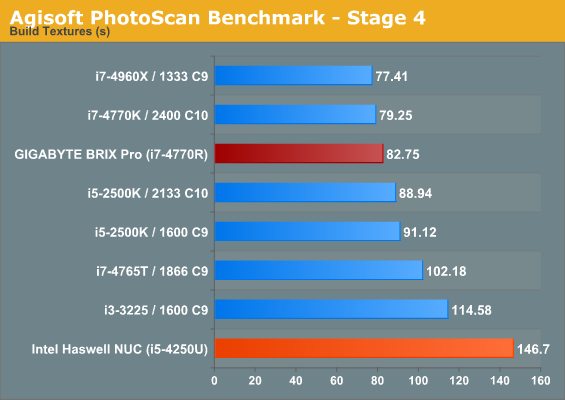
Stage 4: Build Textures
We record the time taken for each stage. Since various elements of the software are single threaded, others multithreaded, and some use GPUs, it is interesting to record the effects of CPU generations, speeds, number of cores, DRAM parameters and the GPU using this software.
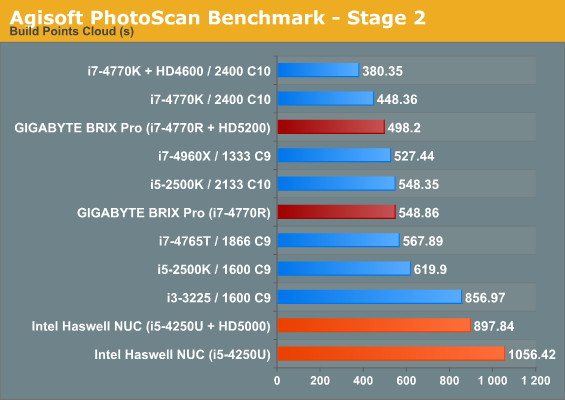
The second stage also reports the throughput rate of the CPU and GPU in million points per second. For the BRIX Pro, in the CPU only mode, we had a rate of 124.99 mp/s. Using OpenCL acceleration, the CPU and GPU had rates of 69.5 mp/s and 98.32 mp/s respectively. The corresponding numbers for the NUC were 68.36 mp/s, 20.39 mp/s and 78.59 mp/s.
Essentially a prosumer real-world test, we hope to put more of our systems under this benchmark in the future. Ian already has a large number of custom-built systems for which he will present benchmarks in his motherboard reviews.


98 Comments
View All Comments
jabber - Tuesday, January 7, 2014 - link
Nice to see more micro systems appearing.PsychoPif - Tuesday, January 7, 2014 - link
Thanks for the quick review, can't wait for the last part.I'm currently looking for a HTPC / casual gaming machine for my home theater and this look like it could be it.
protomech - Tuesday, January 7, 2014 - link
I don't think you want server room noise coming from your htpc.yterbiu - Sunday, January 12, 2014 - link
hah,when you are seeing a movie/playing a game you can hear the noise from that box....you are doing it wrong,matenathanddrews - Tuesday, January 7, 2014 - link
If you define "casual" as a graphic quality setting, then this will get 60fps+ at 720p on low settings in modern games. Move to medium-to-high settings or higher resolutions and it will fall apart. You'll be better served by a new AMD Kaveri system... and probably save quite a bit of money while you're at it.mikk - Tuesday, January 7, 2014 - link
I doubt Kaveri is faster than this Iris Pro 65W.DanNeely - Tuesday, January 7, 2014 - link
The GPU is probably faster, the CPU probably not. In most games the IGP will bottleneck before the CPU does.Drumsticks - Tuesday, January 7, 2014 - link
Given that the iris pro is about as powerful as a 640M (a bit more) and the kaveri 7850k targets 7750 levels of performance, which is faster than the desktop 640 and I think possibly the 650, I think it is safe to say that the GPU will be better. I don't expect the CPU to beat 3+ Ghz Haswell, but we we will see!TeXWiller - Tuesday, January 7, 2014 - link
This thing is about as fast in the 3DMark (2013) Ice Storm and little faster in the Cloud Gate test than my home 1055T with DDR2 800 and 7750.frozentundra123456 - Saturday, January 11, 2014 - link
Nobody really knows the performance of Kaveri yet, but I seriously doubt it will reach even close to HD7750 GDDR5 levels of performance due to bandwidth limitations. And dont forget that is a desktop part. I think 65 watt Kaveri and 65 watt iris pro would be very close in performance, and I actually think the iris pro would be faster. Problem is it is also more expensive, although 529.00 for the 4570R kit is not outrageous.