The Inland Performance Plus 2TB SSD Review: Phison's E18 NVMe Controller Tested
by Billy Tallis on May 13, 2021 8:00 AM ESTBurst IO Performance
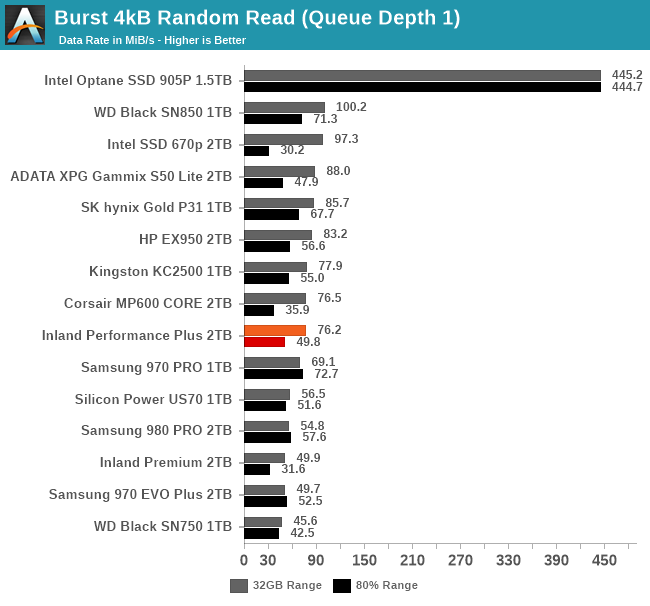
Our burst IO tests operate at queue depth 1 and perform several short data transfers interspersed with idle time. The random read and write tests consist of 32 bursts of up to 64MB each. The sequential read and write tests use eight bursts of up to 128MB each. For more details, please see the overview of our 2021 Consumer SSD Benchmark Suite.
 |
|||||||||
| Random Read | Random Write | ||||||||
| Sequential Read | Sequential Write | ||||||||
On the QD1 burst IO tests, the Inland Performance Plus tops the charts for both random and sequential writes, though in the latter case performance drops quite a lot when the drive is mostly full. Random read performance is merely average, and sequential reads are disappointingly in last place.
Sustained IO Performance
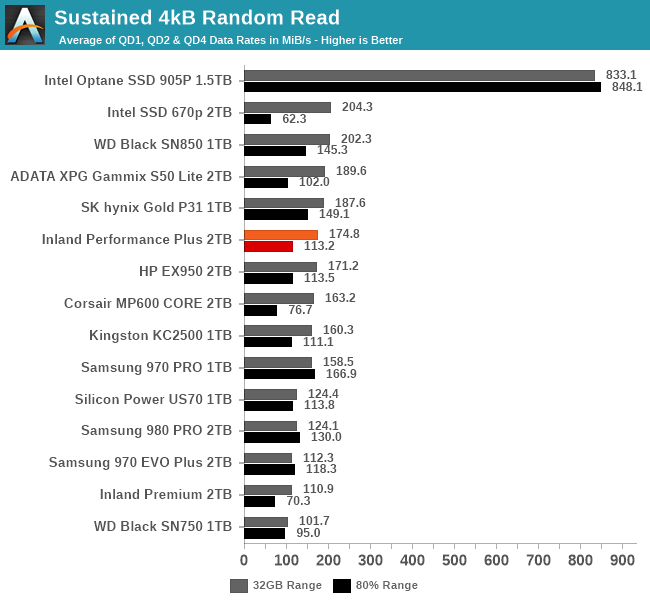
Our sustained IO tests exercise a range of queue depths and transfer more data than the burst IO tests, but still have limits to keep the duration somewhat realistic. The primary scores we report are focused on the low queue depths that make up the bulk of consumer storage workloads. For more details, please see the overview of our 2021 Consumer SSD Benchmark Suite.
 |
|||||||||
| Random Read | Throughput | Power | Efficiency | ||||||
| Random Write | Throughput | Power | Efficiency | ||||||
| Sequential Read | Throughput | Power | Efficiency | ||||||
| Sequential Write | Throughput | Power | Efficiency | ||||||
On the longer IO tests that bring in some higher queue depths, the Performance Plus loses its first-place spot for random writes to the WD Black SN850, but it hangs on to first place for sequential writes. For both random and sequential reads it manages to improve its standings slightly, but the sequential read performance remains disappointing. Power efficiency isn't great on any of these four tests, but it's decent for sequential writes and more or less matches the flagship Gen4 drives from WD and Samsung.
 |
|||||||||
| Random Read | |||||||||
| Random Write | |||||||||
| Sequential Read | |||||||||
| Sequential Write | |||||||||
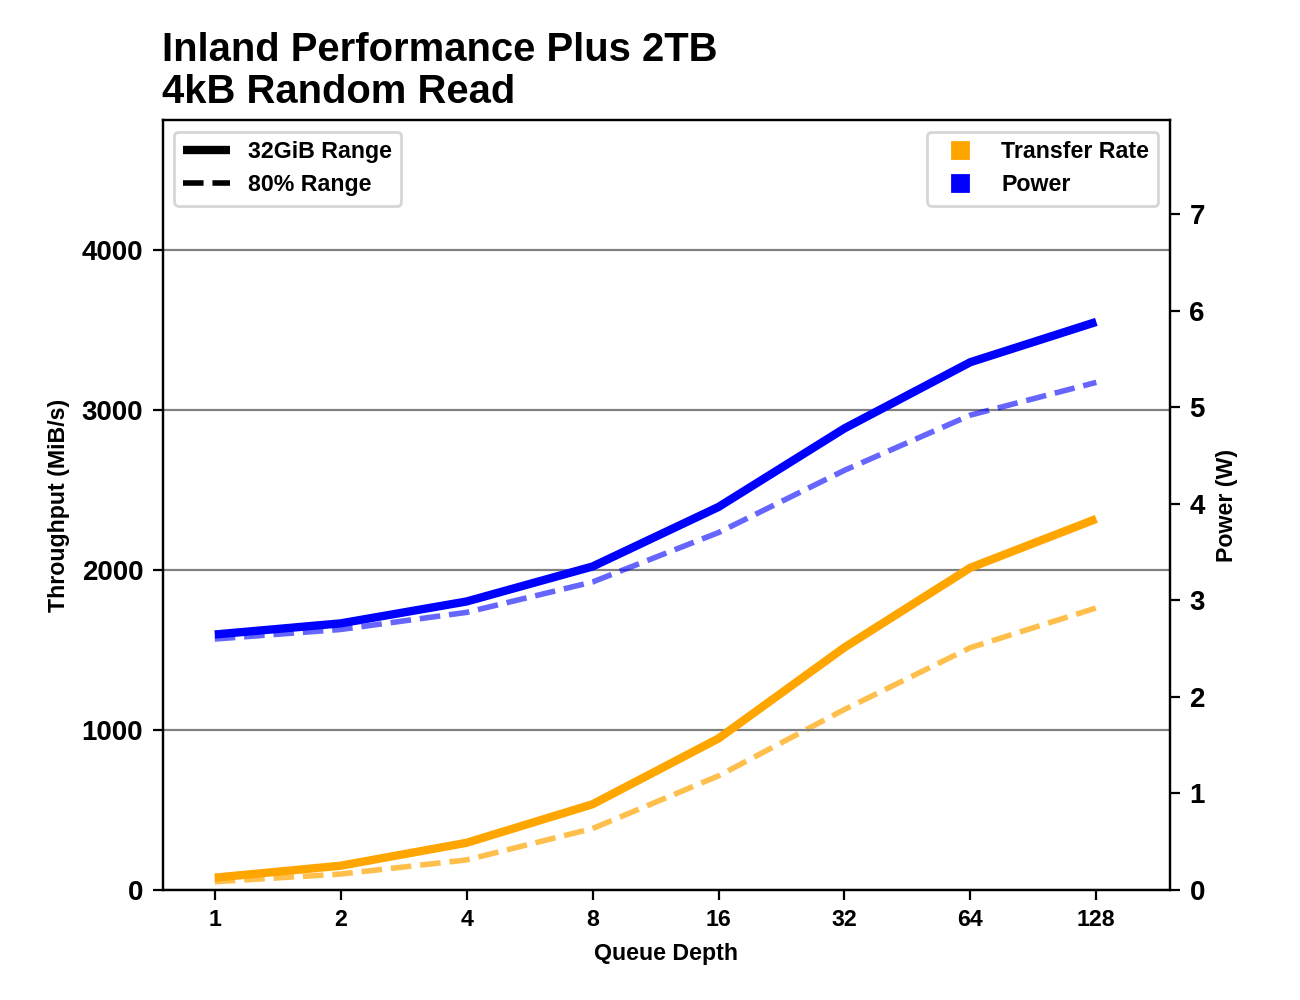
The Inland Performance Plus does eventually reach top-tier performance for sequential reads, but it requires higher queue depths than the 980 PRO or SN850. For sequential writes, it has taken a clear lead by QD4 and maintains higher performance than any of the other drives can hit, with only a slight drop at the end of the test suggesting that the SLC cache might be starting to run out.
For random reads and writes, the Performance Plus simply doesn't scale up as high as its competitors, even with very large queue depths. The Samsung 980 PRO's maximum random write speeds are well beyond what any other drive hits, and for random reads the WD Black SN850 has a similarly large lead over the competition.
Random Read Latency
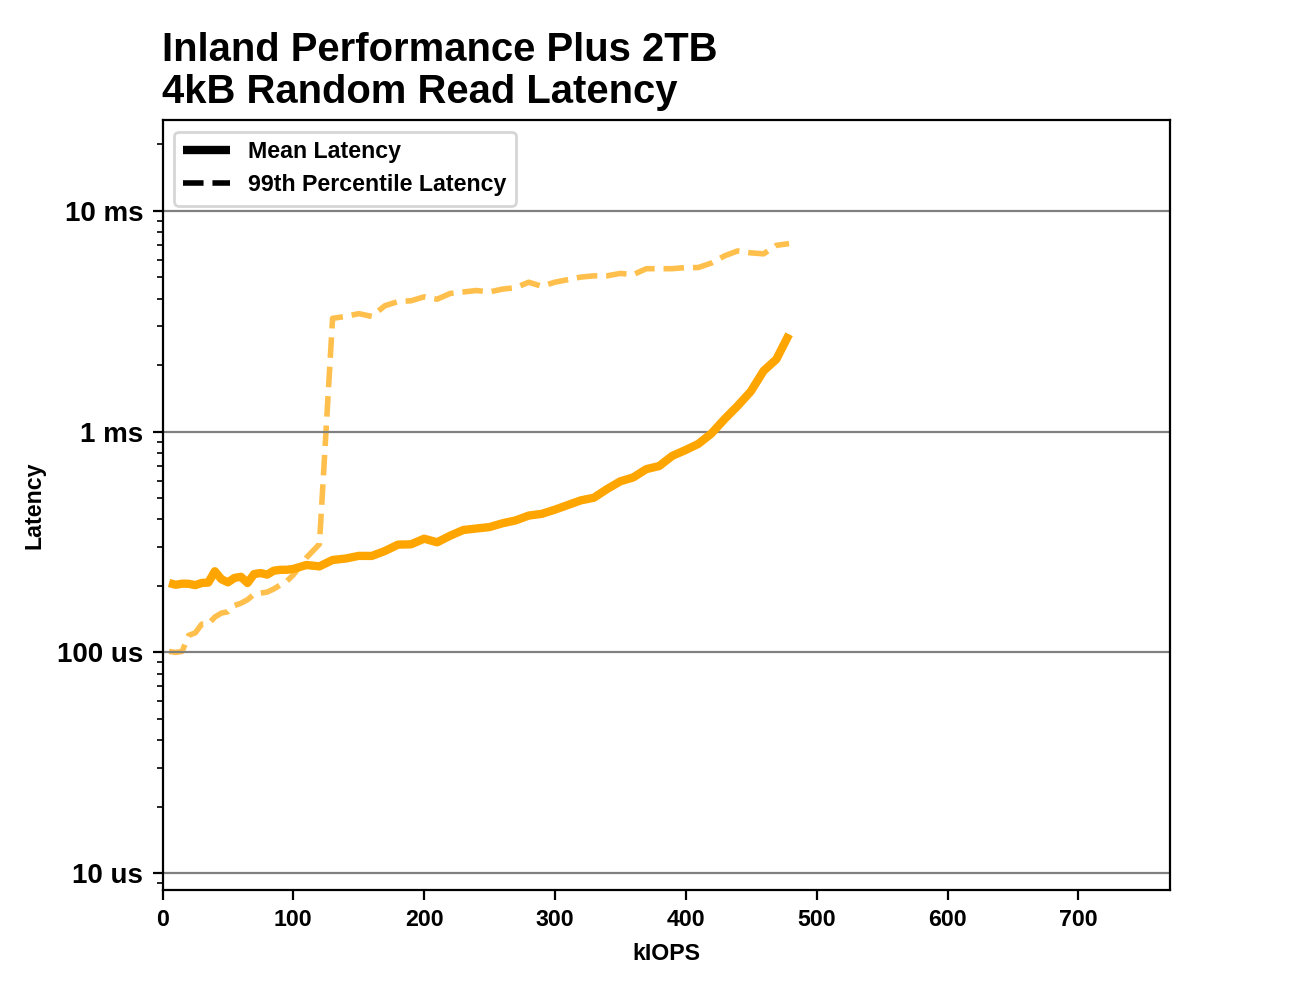
This test illustrates how drives with higher throughput don't always offer better IO latency and Quality of Service (QoS), and that latency often gets much worse when a drive is pushed to its limits. This test is more intense than real-world consumer workloads and the results can be a bit noisy, but large differences that show up clearly on a log scale plot are meaningful. For more details, please see the overview of our 2021 Consumer SSD Benchmark Suite.
 |
|||||||||
At low rates, the mean latency from the Inland Performance Plus is actually higher than the 99th percentile latency, indicating there's a small number of extremely high-latency IOs skewing the average. The median latency starts at a very respectable 63µs, but the highest latency measured at low rates is close to 70ms—three orders of magnitude slower. This looks like the drive might be stalling while waking up from a sleep state, which it shouldn't even be entering given the minimal idle time between test phases. Above 120k IOPS, the 99th percentile latency jumps up to the millisecond range, which should only happen to a drive this high-end when it's pretty close to its maximum throughput. The Performance Plus does achieve respectable throughput that is a clear improvement over the Phison E16, but compared to WD and Samsung flagships the E18 drive is slower and has some mildly concerning performance quirks.


118 Comments
View All Comments
FatFlatulentGit - Thursday, May 13, 2021 - link
Is there a reason the Sabrent Rocket 4 Plus never shows up in the benches? I'm baffled that AT didn't review that one as it uses the Phison E18 and came out about six months ago. You don't even include it in your bench results and it's a flagship PCIe4 M.2 drive. What gives?Linustechtips12#6900xt - Thursday, May 13, 2021 - link
could just be they didn't think of it,Death666Angel - Thursday, May 13, 2021 - link
They probably didn't get sampled one. Sabrent seems more like a non-brand type option and thus likely does not have much of a PR presence.Billy Tallis - Thursday, May 13, 2021 - link
The timing of the first round of review samples of the Rocket 4 Plus didn't work out for us, because I was still putting the finishing touches on the new test suite and had a bit of a backlog of other Gen4 drives to review first. By the time I was ready to start testing an E18 drive, Inland was offering to sample several of their drives, and they're also a frequently requested brand. It wouldn't make sense to review the Rocket 4 Plus now because it's the same underlying hardware as the Inland Performance Plus. We'll wait for the 176L NAND before doing another E18 review.Chaser - Thursday, May 13, 2021 - link
Until Microsoft unshackles Windows from the magnetic Hard disk era, the perceptible difference between most SSDs in Windows desktop is miniscule. But I suppose these reviews and their hairsplitting synthetic benchmarks get clicks.Marlin1975 - Thursday, May 13, 2021 - link
What are you talking about? Performance between platter disk and SSD/M.2 is day and night.evilpaul666 - Thursday, May 13, 2021 - link
There is a huge difference between rust and flash, but we could use some major software improvements and architectural improvements to PCs to move them forward. Maybe persistent memory? A better file system that uses something like compression and checksums on everything similar to ZFS?GeoffreyA - Thursday, May 13, 2021 - link
NTFS has had compression since NT 3.51 or 4, and ReFS, checksums.DougMcC - Sunday, May 16, 2021 - link
It's great and all but linux/mac do most disk intensive activities close to twice as fast. Mac and Linux have completely taken over at my company because of this.GeoffreyA - Sunday, May 16, 2021 - link
Haven't got much experience with Linux but yes, I believe its performance beats Windows on a lot of points.