The Samsung 970 EVO Plus (250GB, 1TB) NVMe SSD Review: 92-Layer 3D NAND
by Billy Tallis on January 22, 2019 10:00 AM ESTWhole-Drive Fill
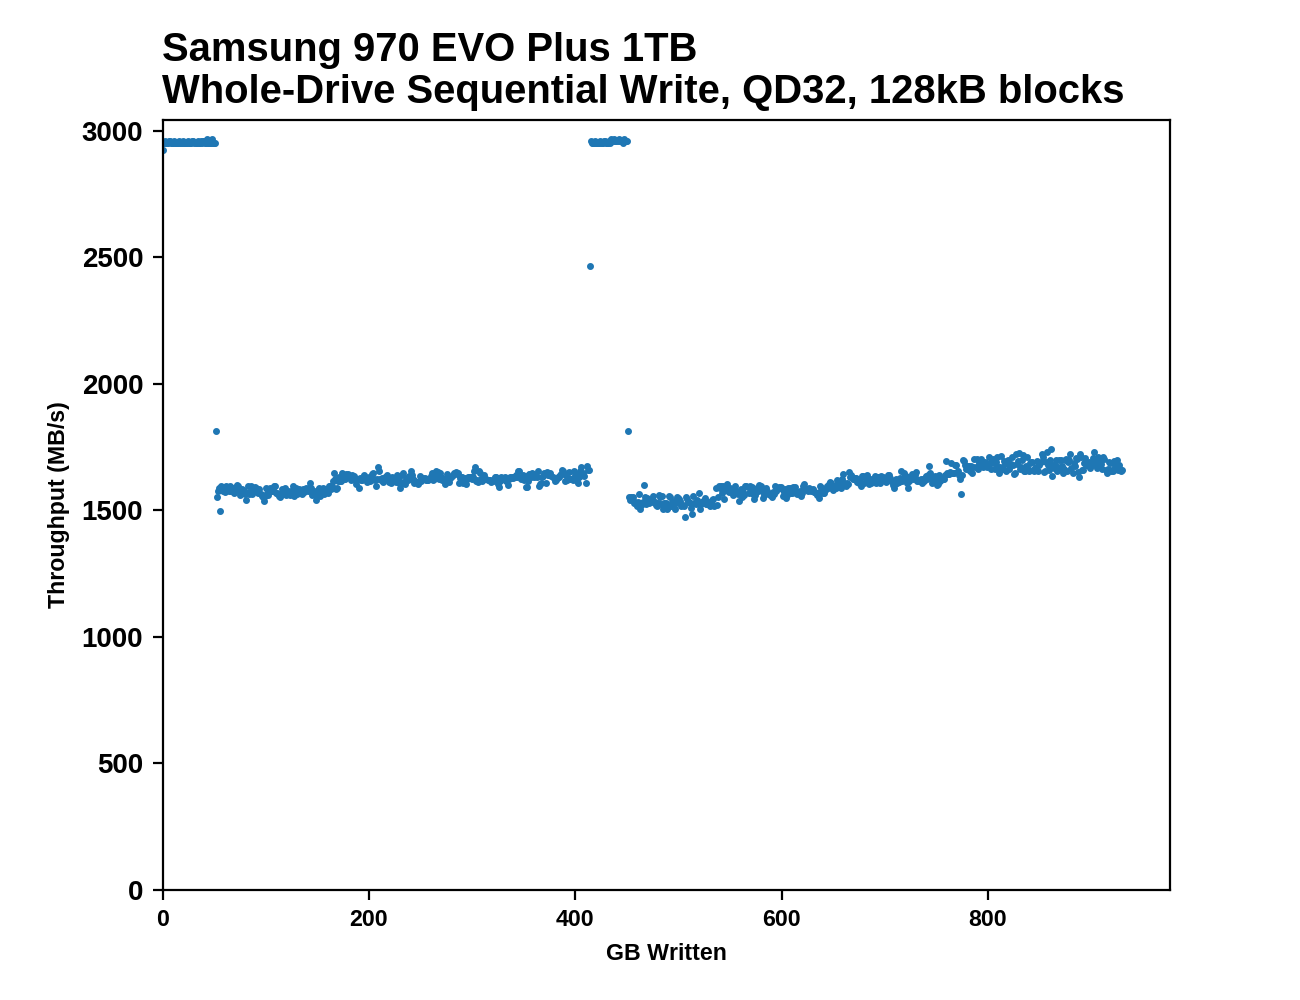
This test starts with a freshly-erased drive and fills it with 128kB sequential writes at queue depth 32, recording the write speed for each 1GB segment. This test is not representative of any ordinary client/consumer usage pattern, but it does allow us to observe transitions in the drive's behavior as it fills up. This can allow us to estimate the size of any SLC write cache, and get a sense for how much performance remains on the rare occasions where real-world usage keeps writing data after filling the cache.
 |
|||||||||
Samsung obviously hasn't changed anything significant about the SLC caching behavior for the 970 EVO Plus: the cache initially runs out right on schedule, and the 1TB model still jumps back up to SLC speed for a short while when the drive is a little less than half full. The change to the underlying NAND does provide a performance boost to the write speeds before and after the cache fills up. The 240GB ADATA XPG SX8200 is an outlier among the small drives: it has a very large variable size SLC cache so it maintains high performance longer than the other drives in that capacity class, but once that cache is full it ends with one of the slowest write speeds.
 |
|||||||||
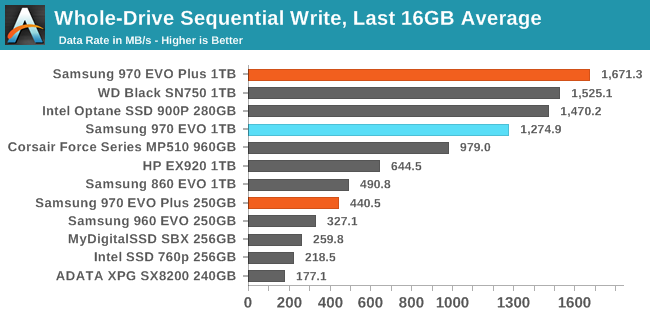
| Average Throughput for last 16 GB | Overall Average Throughput | ||||||||
The improvement to post-SLC sequential write speed isn't quite as big as the 970 EVO Plus specifications promise, but it's still plenty to make it the fastest TLC drive for this test, clearly surpassing the performance of even last week's new WD Black SN750. At the low end of the capacity range, the 250 GB model is well ahead of any other small TLC drive we have tested. It also looks like we are getting quite close to the point where the post-SLC write speed of a small TLC drive can saturate a SATA link, so if Samsung releases another generation of MLC SATA drives for the consumer market it may be impossible to measure any performance advantage over TLC NAND.
BAPCo SYSmark 2018
BAPCo's SYSmark 2018 is an application-based benchmark that uses real-world applications to replay usage patterns of business users, with subscores for productivity, creativity and responsiveness. Scores represnt overall system performance and are calibrated against a reference system that is defined to score 1000 in each of the scenarios. A score of, say, 2000, would imply that the system under test is twice as fast as the reference system.
SYSmark scores are based on total application response time as seen by the user, including not only storage latency but time spent by the processor. This means there's a limit to how much a storage improvement could possibly increase scores, because the SSD is only in use for a small fraction of the total test duration. This is a significant difference from our ATSB tests where only the storage portion of the workload is replicated and disk idle times are cut short to a maximum of 25ms.
| AnandTech SYSmark SSD Testbed | |
| CPU | Intel Core i5-7400 |
| Motherboard | ASUS PRIME Z270-A |
| Chipset | Intel Z270 |
| Memory | 2x 8GB Corsair Vengeance DDR4-2400 CL17 |
| Case | In Win C583 |
| Power Supply | Cooler Master G550M |
| OS | Windows 10 64-bit, version 1803 |
Our SSD testing with SYSmark uses a different test system than the rest of our SSD tests. This machine is set up to measure total system power consumption rather than just the drive's power.
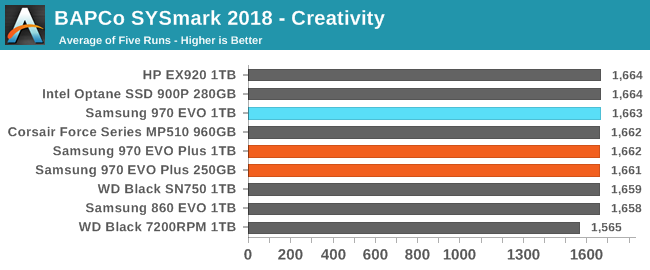
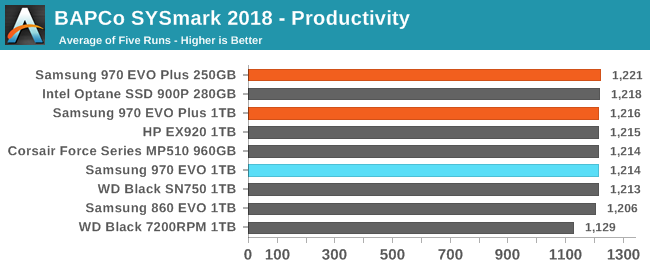
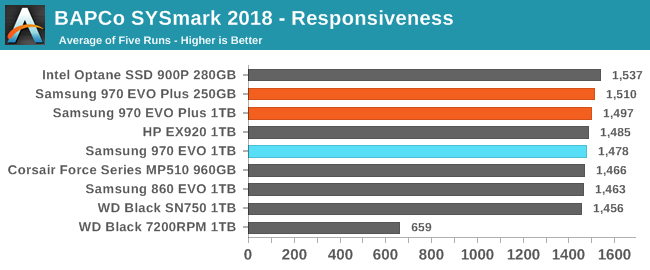
The SYSmark Responsiveness test shows the 970 EVO Plus delivering slightly higher performance than any previous TLC-based SSD, but not quite enough to reach the level of the Intel Optane SSD 900P. Oddly, the 250GB 970 EVO Plus came out a bit ahead of the 1TB model. The other two scenarios—Creativity and Productivity—don't depend on storage performance enough to even show a meaningful difference between the 860 EVO SATA SSD and the fastest NVMe SSDs.
Energy Use
The SYSmark energy use scores measure total system power consumption, excluding the display. Our SYSmark test system idles at around 26 W and peaks at over 60 W measured at the wall during the benchmark run. SATA SSDs seldom exceed 5 W and idle at a fraction of a watt, and the SSDs spend most of the test idle. This means the energy usage scores will inevitably be very close. A typical notebook system will tend to be better optimized for power efficiency than this desktop system, so the SSD would account for a much larger portion of the total and the score difference between SSDs would be more noticeable.
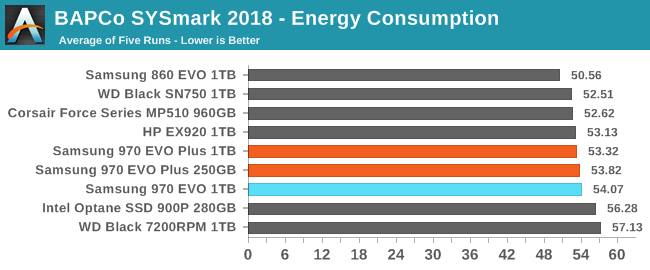
The 970 EVO Plus required a bit less energy to complete a SYSmark run than the original 970 EVO did, but they're still relatively power-hungry compared to other NVMe SSDs, and good SATA SSDs use significantly less power. These differences don't seem like much in the context of our desktop testbed's total power draw, but in a laptop the performance of the 970 EVO Plus does come at some cost to battery life.


35 Comments
View All Comments
Chaitanya - Tuesday, January 22, 2019 - link
Quite a minor upgrade over previous drive.jeremyshaw - Tuesday, January 22, 2019 - link
Hence the name.Billy Tallis - Tuesday, January 22, 2019 - link
More substantial than the WD Black SN750.I don't think we'll see any more big jumps until PCIe 4.0 ships. Pretty much everybody has caught up on the NAND side, and most of the controller vendors have had decent NVMe controllers out for a while. There's no low-hanging fruit like there was when companies were still trying to make SM2260 or Phison E7 compete against Samsung with inferior NAND.
DanNeely - Tuesday, January 22, 2019 - link
More to the point it is a consistent incremental improvement. There've been far too many cases over the years when a v.next drive was an incremental improvement in manufacturing cost, that regressed in most to all performance numbers.boozed - Tuesday, January 22, 2019 - link
I call those performance improvements significant (just).Flunk - Thursday, January 24, 2019 - link
I don't think it's enough to elevate this drive over the high-end Silicon Motion drives in real-world uses. Not for consumers at least.nectrone - Thursday, January 24, 2019 - link
96-layer nand is an improvement on production speed, yields, and manufacturing cost, rather than perf. And tbh, we don't need better perf at all, or maybe a bit in 4k random, because 150MBps is a bit low in 2019. Instead, what we need, is prices to drop, below twice the price of an hdd of the same capacity.In 2018, 1TB tlc nvme 64-layer ssd was 10 times the price of an hdd, now in Jan it's 5 times. Sata 64-layer ssd were 7 times the price of hdd, now it's 3. I'd like TLC nvme to cost twice an hdd, and sata tlc to be the same price as an hdd. With 96-layer, we'll get closer to that.
haukionkannel - Tuesday, January 22, 2019 - link
Pity that the consumer version does not get 4.0 this year... I was hoping to have 4.0 compatible ssd when AMD 570x boards comes out. Well most like with my usage even these Are fast enough and I am not going to be Bottle negged by 3.0.sorten - Wednesday, January 23, 2019 - link
I had the same reaction. I'm running an old gaming PC and I'm ready to switch to AMD with a full set of upgrades at the end of the year and was hoping for PCIE 4.0, but my SSD is so old that I know any drive will be a huge improvement.ikjadoon - Tuesday, January 22, 2019 - link
Meta: has the scrolling video ad been moved to the right? It finally doesn't cover up the article when you scroll. Huge thank you.970 EVO Plus: I'm excited for this to get added to the SSD 2018 Bench. Curious how close it matches the 970 PRO 512GB, now at $170. My almost-full 250GB 960 EVO needs a capacity increase and $40 isn't a big difference for a minimum two-year purchase.