The Seagate BarraCuda (500GB) SSD Review: Getting Back In The Game
by Billy Tallis on December 7, 2018 8:00 AM ESTWhole-Drive Fill
This test starts with a freshly-erased drive and fills it with 128kB sequential writes at queue depth 32, recording the write speed for each 1GB segment. This test is not representative of any ordinary client/consumer usage pattern, but it does allow us to observe transitions in the drive's behavior as it fills up. This can allow us to estimate the size of any SLC write cache, and get a sense for how much performance remains on the rare occasions where real-world usage keeps writing data after filling the cache.
 |
|||||||||
The SATA bottleneck renders the SLC caching behavior of the Seagate BarraCuda largely irrelevant for sequential writes. Aside from a momentary blip around the 4GB mark, the BarraCuda stays near the limits of the SATA link for the entire drive filling process.
 |
|||||||||
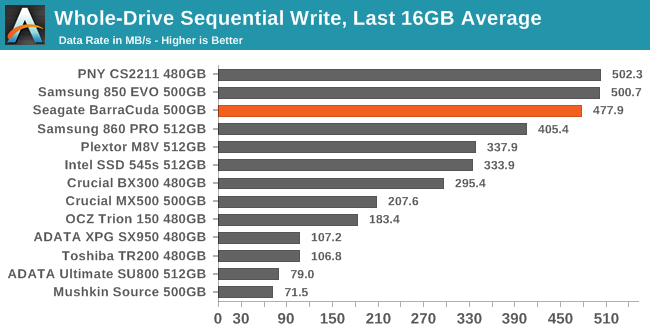
| Average Throughput for last 16 GB | Overall Average Throughput | ||||||||
The Seagate BarraCuda isn't quite able to match the fastest SATA SSDs for sustained write speed, but it is less than 5% slower. Drives with Silicon Motion's 4-channel SATA SSD controllers have shown that there's no real need for 8-channel controllers in the SATA space anymore, but the 8-channel design of the Phison S10 does convey some fringe benefits as seen here.
BAPCo SYSmark 2018
BAPCo's SYSmark 2018 is an application-based benchmark that uses real-world applications to replay usage patterns of business users, with subscores for productivity, creativity and responsiveness. Scores represnt overall system performance and are calibrated against a reference system that is defined to score 1000 in each of the scenarios. A score of, say, 2000, would imply that the system under test is twice as fast as the reference system.
SYSmark scores are based on total application response time as seen by the user, including not only storage latency but time spent by the processor. This means there's a limit to how much a storage improvement could possibly increase scores, because the SSD is only in use for a small fraction of the total test duration. This is a significant difference from our ATSB tests where only the storage portion of the workload is replicated and disk idle times are cut short to a maximum of 25ms.
| AnandTech SYSmark SSD Testbed | |
| CPU | Intel Core i5-7400 |
| Motherboard | ASUS PRIME Z270-A |
| Chipset | Intel Z270 |
| Memory | 2x 8GB Corsair Vengeance DDR4-2400 CL17 |
| Case | In Win C583 |
| Power Supply | Cooler Master G550M |
| OS | Windows 10 64-bit, version 1803 |
Our SSD testing with SYSmark uses a different test system than the rest of our SSD tests. This machine is set up to measure total system power consumption rather than just the drive's power.
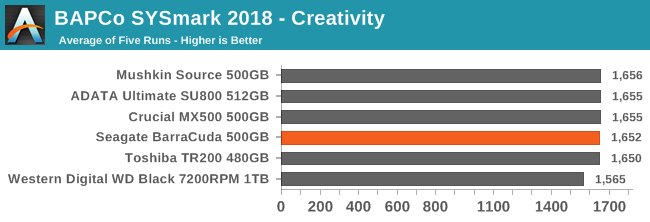
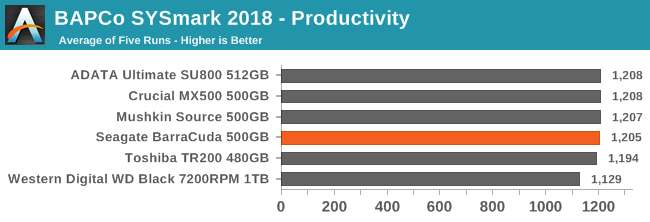
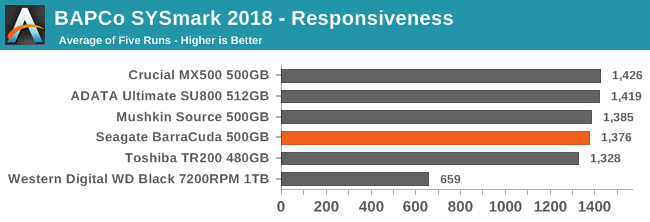
The Seagate BarraCuda provides adequate performance for the CPU and memory-bound Creativity and Productivity scenarios, but on the Responsiveness test it comes up a bit short of what a mainstream SATA SSD should deliver. Instead, it scores more in line with the DRAMless SATA SSDs, which is still far better than a 7200RPM hard drive.
Energy Usage
The SYSmark energy usage scores measure total system power consumption, excluding the display. Our SYSmark test system idles at around 26 W and peaks at over 60 W measured at the wall during the benchmark run. SATA SSDs seldom exceed 5 W and idle at a fraction of a watt, and the SSDs spend most of the test idle. This means the energy usage scores will inevitably be very close. A typical notebook system will tend to be better optimized for power efficiency than this desktop system, so the SSD would account for a much larger portion of the total and the score difference between SSDs would be more noticeable.
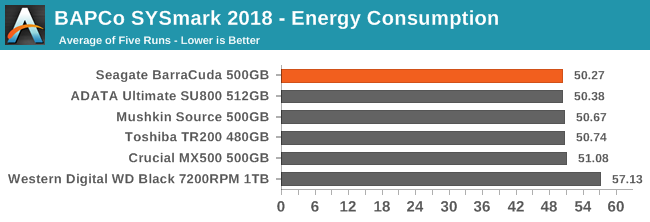
The overall system energy usage during SYSmark is reasonably low for the Seagate BarraCuda, indicating that the slightly lower performance of the BarraCuda doesn't add much to the overall runtime of the test. The good active idle power management (see page 9) also contributes to this good score.


39 Comments
View All Comments
Hulk - Friday, December 7, 2018 - link
Fantastic review as always. Thanks for your hard work.But I'm curious as to why the Samsung EVO 860 isn't in the benchmarks. It was recently selling for under $130 (not back at $150) and seems to be the benchmark to which most drives in this category should be compared?
Gasaraki88 - Friday, December 7, 2018 - link
The 850 EVO and 860 EVO are very similar in performance.Samus - Friday, December 7, 2018 - link
The problem for Samsung's consumer market is they've been making drives that max out the capabilities of SATA for 5 years. There just isn't much more room to improve.And the problem for Samsung's prosumer market is the WD Black NVMe is an overall better value than the 970 NVMe, ESPECIALLY in mobile where the 970's (even the EVO) are so power hungry they constantly throttle in laptops, while reducing battery life.
Samsung is riding on reputation right now. Superior products in the SATA space are irrelevant because at the high end you wont notice a real difference between SATA drives. And in the NVMe space, there are plenty of players on par with Samsung.
zodiacfml - Monday, December 10, 2018 - link
I used to think that SATA is dumb for recent SSDs. However, I noticed that it is only for sequential workloads which can be left running in the background. SATA still has a lot of life for SSDs.The 2.5" form factor is still dumb though. It is huge waste of space and materials.
Can't they make the case the size of the PCB using only the first pair of screws for mounting?
derekullo - Monday, December 10, 2018 - link
The reason this was done was to safe on space knowing that eventually they would deployed in laptops.Another reason was that when ssds were first being released with SLC, they were incredibly expensive and nobody could afford to buy your 1 Terabyte 3.5" drive filled to the brim with SLC nand. Of course we can afford it now ...
derekullo - Monday, December 10, 2018 - link
save on space* be deployed*Billy Tallis - Friday, December 7, 2018 - link
My smallest 860 EVO sample is 1TB, and I didn't want to put that on the graphs as the only drive of that capacity. Performance generally increases with drive capacity, so the 1TB would exaggerate the performance advantage of the 860 EVO over the BarraCuda (and probably slightly understate the efficiency advantage). You can make the comparison with our Bench tool if you're interested: https://www.anandtech.com/bench/product/2201?vs=21...Hulk - Friday, December 7, 2018 - link
Okay that makes sense.Death666Angel - Friday, December 7, 2018 - link
2.5" SATA SSDs should just become M.2 SATA SSDs with a caddy. :)Dragonstongue - Friday, December 7, 2018 - link
not everyone has m.2 on their boards and many of those boards overheat the drive in that slot anyways....t each own, "slow" drives are best kept as full out SATA sized drive (which vast majority are 2.5" anyways. the samsung 8/9xx are "unique" in that the pcb housing the memory chips etc is quite small compared to many so they "easily" put on a m.2 "gum stick"