Zotac ZBOX MAGNUS EN1080K Compact Gaming PC Review
by Ganesh T S on January 2, 2018 8:00 AM ESTPerformance Metrics - I
The Zotac ZBOX MAGNUS EN1080K was evaluated using our standard test suite for low power desktops / industrial PCs. Not all benchmarks were processed on all the machines due to updates in our testing procedures. Therefore, the list of PCs in each graph might not be the same. In the first section, we will be looking at SYSmark 2014 SE, as well as some of the Futuremark benchmarks.
BAPCo SYSmark 2014 SE
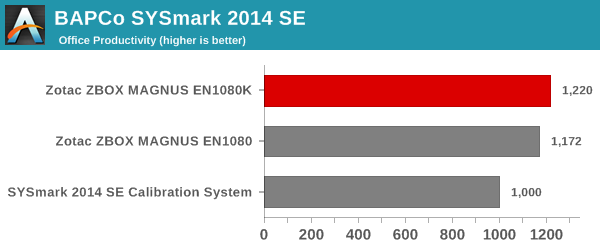
BAPCo's SYSmark 2014 SE is an application-based benchmark that uses real-world applications to replay usage patterns of business users in the areas of office productivity, media creation and data/financial analysis. In addition, it also addresses the responsiveness aspect which deals with user experience as related to application and file launches, multi-tasking etc. Scores are meant to be compared against a reference desktop (the SYSmark 2014 SE calibration system in the graphs below). While the SYSmark 2014 benchmark used a Haswell-based desktop configuration, the SYSmark 2014 SE makes the move to a Lenovo ThinkCenter M800 (Intel Core i3-6100, 4GB RAM and a 256GB SATA SSD). The calibration system scores 1000 in each of the scenarios. A score of, say, 2000, would imply that the system under test is twice as fast as the reference system.

SYSmark 2014 SE also adds energy measurement to the mix. A high score in the SYSmark benchmarks might be nice to have, but, potential customers also need to determine the balance between power consumption and the efficiency of the system. For example, in the average office scenario, it might not be worth purchasing a noisy and power-hungry PC just because it ends up with a 2000 score in the SYSmark 2014 SE benchmarks. In order to provide a balanced perspective, SYSmark 2014 SE also allows vendors and decision makers to track the energy consumption during each workload. In the graphs below, we find the total energy consumed by the PC under test for a single iteration of each SYSmark 2014 SE workload and how it compares against the calibration systems.

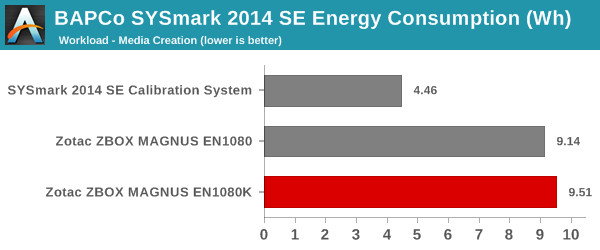
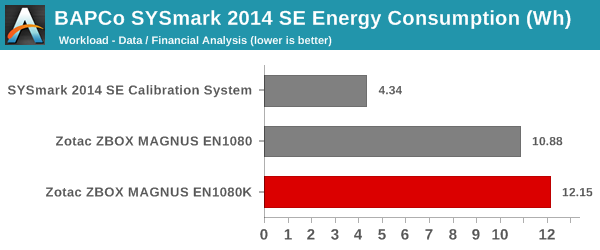
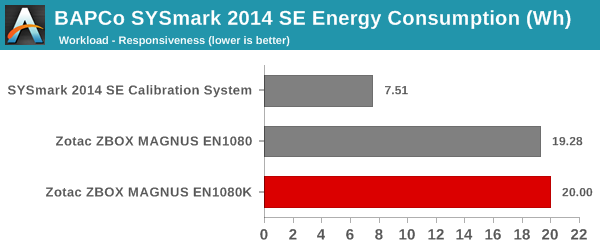
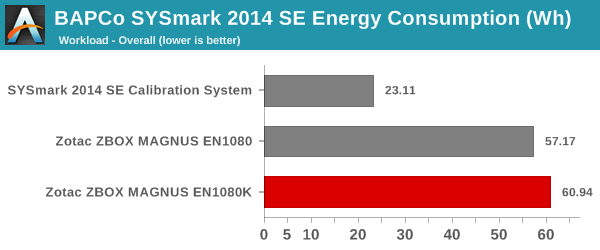
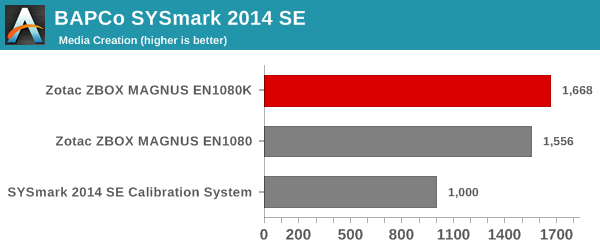
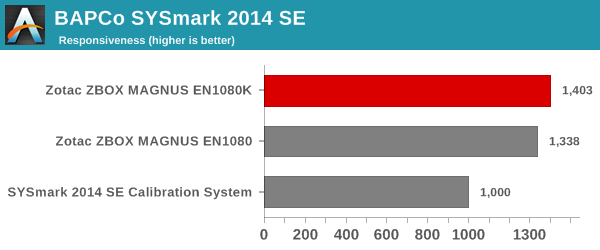
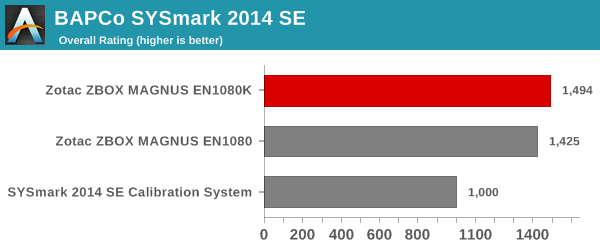
As expected, the clock speed boost of the Core i7-7700 over the Core i7-6700 helps the EN1080K deliver better benchmark numbers compared to the EN1080 across all the workloads. However, it does come at the cost of increased energy consumption (some of which can be attributed to the faster memory clock also).
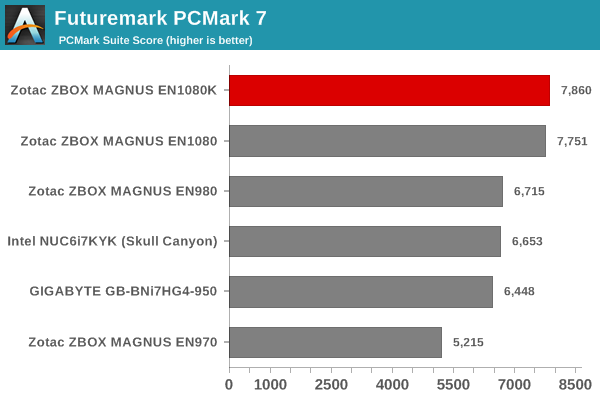
Futuremark PCMark 10
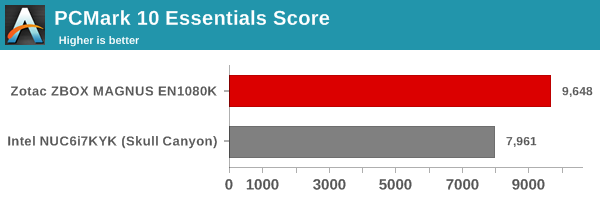
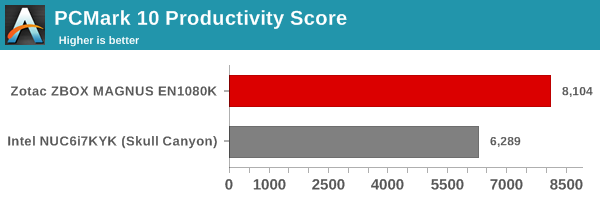
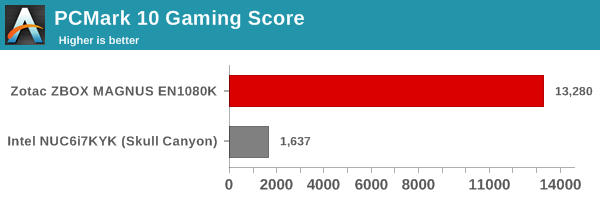
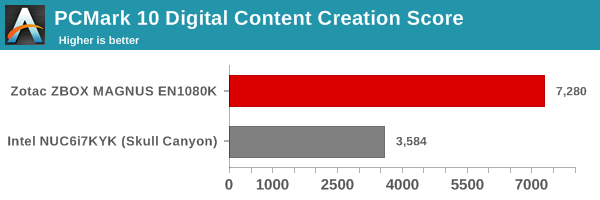
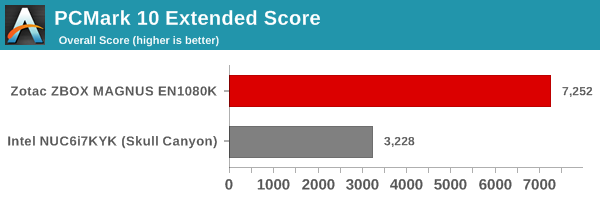
UL's PCMark 10 evaluates computing systems for various usage scenarios (generic / essential tasks such as web browsing and starting up applications, productivity tasks such as editing spreadsheets and documents, gaming, and digital content creation). We benchmarked select PCs with the PCMark 10 Extended profile and recorded the scores for various scenarios. These scores are heavily influenced by the CPU and GPU in the system, though the RAM and storage device also play a part. The power plan was set to Balanced for all the PCs while processing the PCMark 10 benchmark.
PCMark 10 is a new addition to our benchmark suite, and our list of SFF systems with recorded scores is just getting started. We only have the Core i7-6700HQ-based Skull Canyon to compare against. The Core i7-7700 with the much faster clocks and higher TDP, as well as a GPU that is miles ahead (NVIDIA GTX 1080 vs. Intel Iris Pro Graphics 580) enable the EN1080K to easily outscore the NUC6i7KYK.
Futuremark PCMark 8
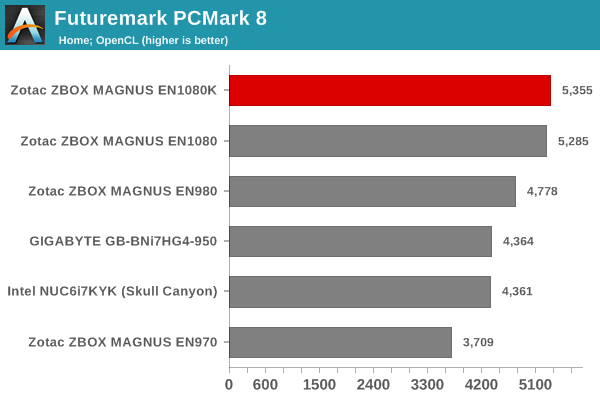
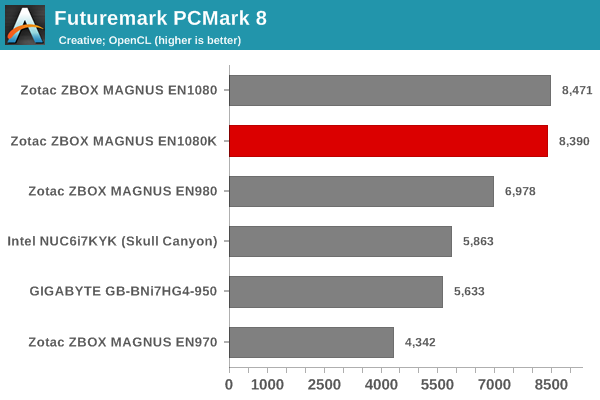
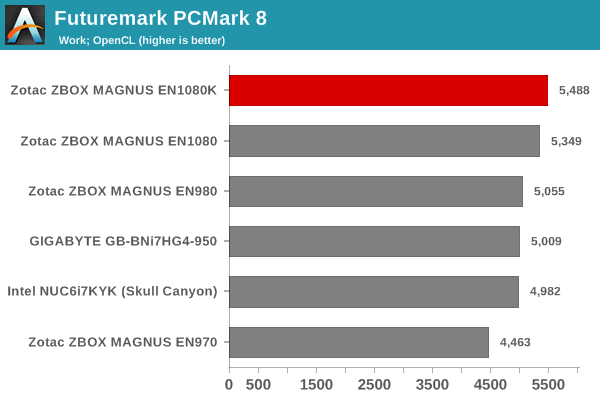
We continue to present PCMark 8 benchmark results (as those have more comparison points) while our PCMark 10 scores database for systems grows in size. PCMark 8 provides various usage scenarios (home, creative and work) and offers ways to benchmark both baseline (CPU-only) as well as OpenCL accelerated (CPU + GPU) performance. We benchmarked select PCs for the OpenCL accelerated performance in all three usage scenarios. These scores are heavily influenced by the CPU in the system. The EN1080K outscores the EN1080 on almost all of these benches.
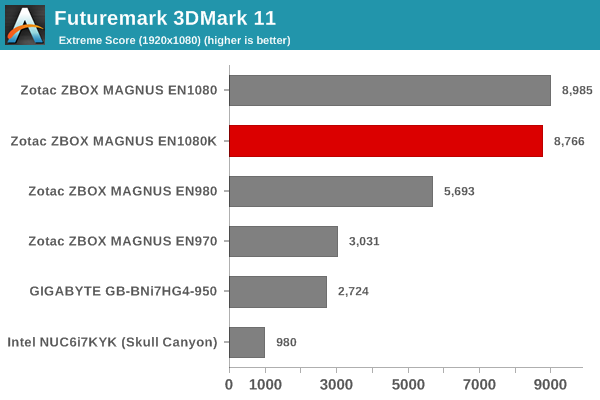
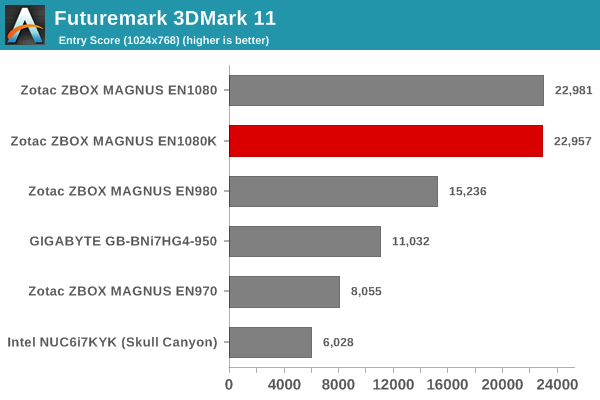
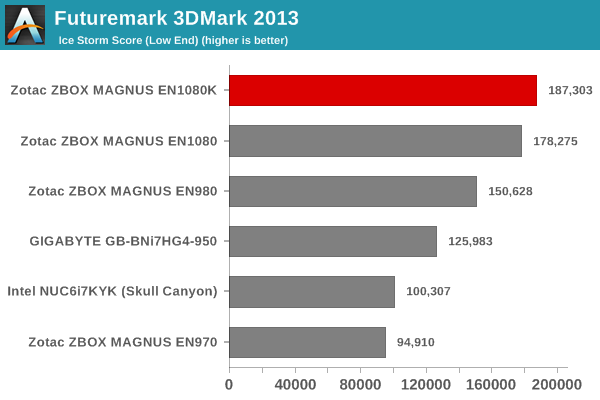
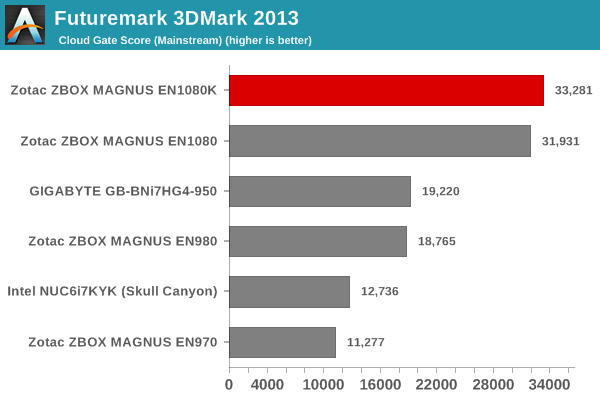
Miscellaneous Futuremark Benchmarks
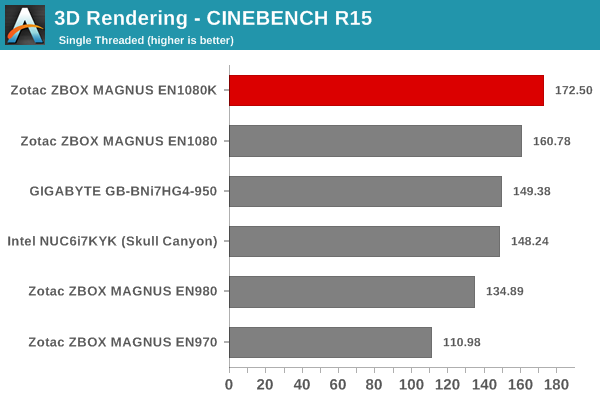
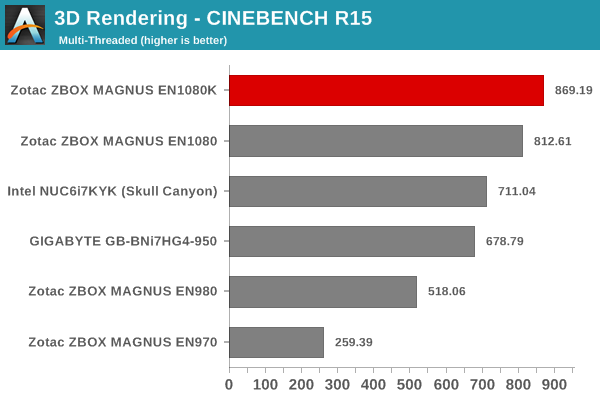
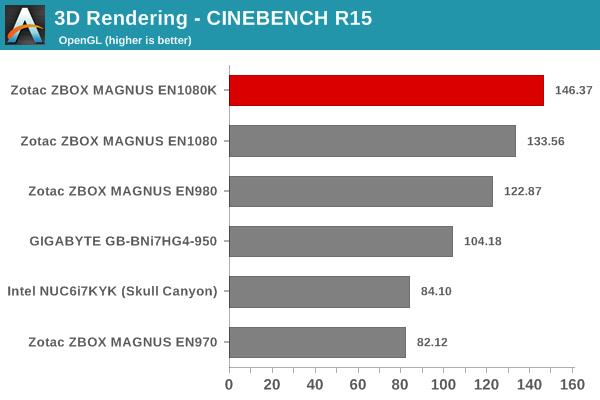
3D Rendering - CINEBENCH R15
We have moved on from R11.5 to R15 for 3D rendering evaluation. CINEBENCH R15 provides three benchmark modes - OpenGL, single threaded and multi-threaded. Evaluation of select PCs in all three modes provided us the following results. As expected, the EN1080K comes out on top in all modes.


12 Comments
View All Comments
Sane Indian - Tuesday, January 2, 2018 - link
Why Mini PCs cost more than a Laptop or proper desktops?https://www.acer.com/ac/en/US/content/predator-mod...
TheinsanegamerN - Tuesday, January 2, 2018 - link
Because it is even MORE tech, more power hungry, with more cooling then any laptop, in a smaller space, with a smaller market?DanNeely - Tuesday, January 2, 2018 - link
Even lower production volumes than laptops, meaning each sale has to cover a larger chunk of the total R&D budget.nerd1 - Tuesday, January 2, 2018 - link
It does NOT cost more than equivalent laptop (7700 and GTX 1080)Rookierookie - Tuesday, January 2, 2018 - link
On Newegg, a Clevo laptop with i7-8700K, GTX 1080, 32GB RAM, 512GB SSD+1TB HDD goes for $2449. So pretty darn close.JoeyJoJo123 - Tuesday, January 2, 2018 - link
"free" keyboard, mouse, display included with the Clevo, as well. And the thinner profile more easily fits into a backpack or carrying bag, as opposed to a cube-like shape.cosmotic - Wednesday, January 3, 2018 - link
At least the zotac doesn't look like a tragedy like the Clevo.Death666Angel - Wednesday, January 3, 2018 - link
The Zotac EN1080K goes for 1910€ in Germany. Cheapest 1080 laptop is and ASUS ROG with a 6700HQ, 512GB SSD and 16GB RAM. 6-core 8700 based Schenker Laptop (Clevo rebrand) goes for 2820€. The Zotac with 512GB SSD and 16GB RAM is 2200€, plus OS, so maybe 2250. But for that I would bet you get better cooling and much better IO options. Sure, you lose the built in display and peripherals, but they serve different use cases. If you want a luggable, portable solution, why look at this thing. If you want a stationary thing that is out of the way, why look for a laptop with a large footprint.Flunk - Wednesday, January 3, 2018 - link
It's mostly because the Clevo is enormous. You pay for the engineering to get something this small.Flunk - Wednesday, January 3, 2018 - link
This is also a bit of boutique system, they're not going to sell many of these.