Server Clash: DELL's Quad Opteron DELL R815 vs HP's DL380 G7 and SGI's Altix UV10
by Johan De Gelas on September 9, 2010 7:30 AM EST- Posted in
- IT Computing
- AMD
- Intel
- Xeon
- Opteron
VMWare's VMmark
Before we take a look at our own virtualization benchmarking, let us look at the currently (end of August 2010) available VMmark scores.
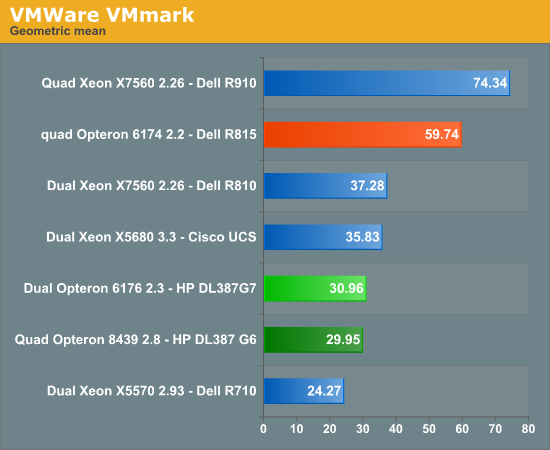
According to VMmark, the quad Xeon 7560 is about 25% faster than the quad Opteron 6174. VMmark gives a rough idea, but only a rough one. We already wrote down our doubts about VMmark, but here comes another one. The score of 75.34 is achieved with 300 VMs (50 tiles) and 512GB of RAM. That means that each physical Xeon 7500 core is shared by 9.4 VMs ! Now to be honest, this is not the real problem as quite a few servers out there have lots of virtual CPUs mapped onto one CPU. The problem is that VMmark scores use throughput, so the OEM benchmarking experts are completely focusing on throughput and not response times. The result of this is that you get very low (slow), possibly even unacceptable, performance per VM.
Let us make this clearer. If you look at the first pages of the VMmark result disclosure of the Dell R815 or Dell R910, you’ll see that the geometric mean score of one tile is around 1.5 (look at the number at the far right). To refresh your memory, a tile consist of 5 active and one idle workload:
- MS Exchange (2 CPUs)
- SpecJBB (Java Server, 2 CPUs)
- Apache web server VM (2 CPUs)
- MySQL database VM (2 CPUs)
- SAMBA file server VM (1 CPU)
- Idle VM
If one tile gets a score of 1.5, it means that it is 50% faster than the reference system which ran only one tile. However, the reference system was an old HP Proliant DL580 G2. This system contained two 2.2GHz single-core Intel Xeon CPUs with Hyper-Threading support, and had 16GB of memory. That is a 130nm Xeon “Galatin”, a CPU very similar to the Pentium 4 “Northwood” Desktop CPU. This is a pretty old Xeon: it was introduced in March 2004. Galatin had a 512KB L2 cache like “Northwood”, but a 2MB L3 cache was added to improve scalability, as this was a Xeon MP processor made for quad socket configurations.
Now Galatin was a pretty decent CPU when it came out, but this CPU was not made nor suitable for a virtualizated consolidation scenario. It had no hardware virtualization whatsoever, and the VM Exit and Entry overhead was no less than six times (and more!) worse than on the Xeon “Nehalem”. You can imagine that running five applications on two of those single core CPUs is not exactly a speedy experience. The file server achieved a "blazing 10MB/s" and the website (the e-commerce website of SPECweb2005) could keep up with about 17 hits per second. Now achieving 50% more than that with an ultra modern system will not please many users. Imagine the surprise of tens of users that have to share a 15MB/s stream while they connect via their 1 gigabit Ethernet ports to the spanking new “state-of-the-art” server that has 10 Gbit Ethernet available.
So the trouble with VMmark is that the highest scores are only a measure of the total throughput; the throughput of the individual applications however is pretty miserable. It is not just a server that is running at 100%, it is a server that is completely overutilized. So the benchmark favors throughput to the extreme, which may well exaggerate differences between the competing systems.


51 Comments
View All Comments
Chrisrodinis - Thursday, February 27, 2014 - link
This article is about Dell servers in 2010. For comparison purposes here is an overview of a Dell PowerEdge M420 Blade server. This video has cool effects with upbeat production values. Please check it out, thanks: https://www.youtube.com/watch?v=iKIG430z0PI