The Impact of Spare Area on SandForce, More Capacity At No Performance Loss?
by Anand Lal Shimpi on May 3, 2010 2:08 AM ESTThe Impact of Spare Area on Performance
More spare area can provide for a longer lasting drive, but the best way to measure its impact is to look at performance (lower write amplification leads to lower wear which ultimately leads to a longer lifespan).
SandForce's controllers are dynamic: they'll use all free (untouched or TRIMed) space on the drive as spare area. To measure the difference in performance between a drive with 28% spare area and one with 13% we must first fill the drives to their capacity. The point being to leave the controller with nothing but its spare area to use the moment we start writing to it. Unfortunately this is easier said than done with a SandForce drive.
If you just write sequential data to the drive first there's no guarantee that you'll actually fill up the NAND. The controller may just do away with a lot of the bits and write a fraction of it. To get around this problem we resorted to our custom build of iometer that let's us write completely random data to the drive. In theory this should get around SandForce's algorithms and give us virtually 1:1 mapping between what we write and what ends up on the NAND.
That’s not enough though. The minute we run one of our desktop workloads on the SandForce drive it’ll most likely toss out most of the bits and only lightly tap into the spare area. To be sure let’s look at the results of our AT Storage Bench suite if we first fill these drives with completely random, invalid data. Every time our benchmark scripts write to the drive it should force a read-modify-write and tap into some of that spare area.
This graph shows the percentage of new performance once the drive is completely full. Dynamic controllers like Intel’s and SandForce’s will show a drop here as they use any unused (or TRIMed) space as spare area. The Indilinx Barefoot controller doesn’t appear to and thus shows no performance hit from a full drive.
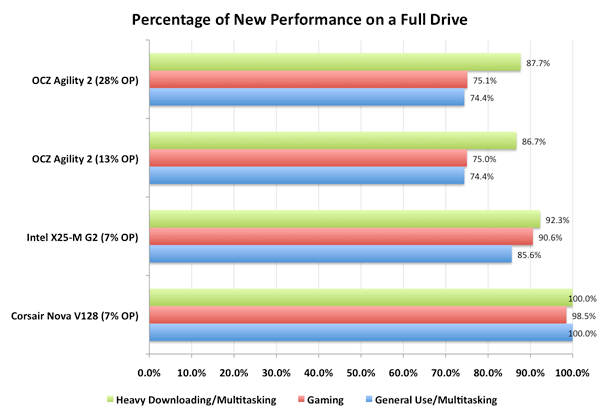
You’ll note that there’s virtually no difference between a SF-1200 drive with 13% spare area and one with 28% spare area. Chances are, most users would agree. However I’m not totally satisfied. What we want to see is the biggest performance difference a desktop/notebook user would see between a 13% and 28% overprovisioned drive. To do that we have to not only fill up the user area on the drive but also dirty the spare area as well. Another pass of our Iometer script with some random writes thrown in should do the trick. Now all LBAs on the drive should be touched as well as the spare area.
Once again, let’s look at the percentage of new performance from our very full, very dirty drive:
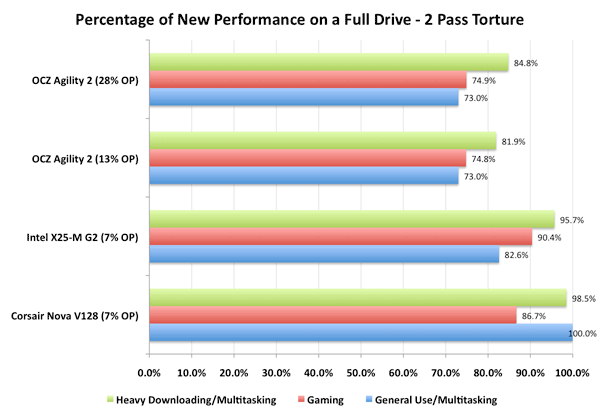
Now we’re getting somewhere. Intel’s controller actually improved in performance between the runs (at least in the heavy downloading/multitasking test), which is a testament to Intel’s architecture. The X25-M is an overachiever, it’s in a constant state of trying to improve itself.
The SandForce controller is being unfairly penalized here - most desktop workloads shouldn’t hit it with so much data that’s purely random in nature. But we’re trying to understand the worst case scenario. And there is a difference, just a very slight one. Only in the heavy downloading/multitasking workload did we see a difference between the two spare area capacities and it’s only about 3 percentage points.


30 Comments
View All Comments
Spoelie - Monday, May 3, 2010 - link
One area I think that might still be affected is reliability. SandForce stated that (1) smaller geometries introduce more defects and (2) manufacturers could use cheaper, less reliable flash in drives with their controllers.Does the reduction of spare area impart reduced lifetime/reliability in the above scenarios or is its responsibility purely one for performance? I reckon it's not something one would be able to measure though.
GeorgeH - Monday, May 3, 2010 - link
Reliability will go down. 28% wasn't a random choice, it was selected to deliver a certain MTBF. AFAIK the "enterprise" drives use the same 28%, though, so "consumer" usage models should be able to get by with less.The real question is how they arrived at 13% - is it Bean Counter Bob's number or Engineer Eric's number? Until they answer that question and release their methodology for arriving at 13%, I wouldn't touch one of these with a thousand foot pole. The chance that 13% was the misguided result of some accountant waddling over to the R&D department for 5 minutes is just too great relative to the small benefit of 10-20 "free" GB's.
softdrinkviking - Monday, May 3, 2010 - link
i wonder how much of a role the spare area plays in maintaining the compression algorithms for the sandforce controller.it's seems like, with such a complex controller, it would be wise to have plenty of "hash or index" space to work with, or is that all stored somewhere else?
jleach1 - Monday, May 3, 2010 - link
IDK about you...but i dont plan on keeping a drive this small for that long. A few years is reasonable. Right now, what people want is: a cheap drive that performs well. I'll gladly trade 6 months of the life of my drive for some badly needed space. In 6 months, theyll likely have a set of firmware options that increase the amount of usable space, and improved algorithms that offset the normal reliability problems.Good job OCZ. Less $/GB= a happier public.
softdrinkviking - Wednesday, May 5, 2010 - link
my question was about how the amount of spare area would effect the short term reliability of the drive. assuming that these drives are relatively unproven, who's to say that they won't start losing data because of the complex compression used by the controller?i want to know if lessening the spare area could contribute to controller errors, leading to the loss of data.
Belard - Monday, May 3, 2010 - link
Looking at your benchmarks, other than SATA 3/6GB/s system, the Intel X25-M (G2) are still constantly the fastest and most reliable on the market. Personally, I can't wait for the SSD market to have SATA-3 drives as standard.Seq. Read
OCZ = 264 MB/s * (okay a bit faster)
X25 = 256 MB/s
Seq. Write
OCZ = 252 MB/s * (Destroys the intel)
X25 = 102 MB/s
But most operations are random... So if you're doing Video encode/decode or copy, the OCZ kills.
Random. Read
OCZ = 52 MB/s
X25 = 64 MB/s * Intel wins easily. Even the top 6GB/s is barely faster.
Random Write
OCZ = 44 MB/s
X25 = 46 MB/s * (not bad for an OLD drive)
Half the drives are much slower, but some of the best easily faster.
It will be intresting to see what happens to the SSD market in 12 months.
7Enigma - Monday, May 3, 2010 - link
I kinda feel the same way. Since we have not yet reached the point where a large portion of our data is stored on these (most of us at least), these sequential writes just don't blow me away the same way the X25 changed the HD scene. After the intial setup (OS, programs, a couple games), the drive is basically going to be a random read/write drive with occassional install, and for that I can wait the extra time that a faster drive would have saved if the end result (gaming/bootup/etc.) is nearly the same.What I want to see is the game-changing performance the X25 did to the traditional HD in the random read/write metric. Get those into the 200-300MB/sec and THEN I'll get excited again.
The0ne - Monday, May 3, 2010 - link
Reading all the latest Anandtech SSD reviews feels like I'm reading someone's hobby work :) So many changes. Can't wait til it stabilizes A LOT more.sgilmore1962 - Monday, May 3, 2010 - link
Random WriteOCZ = 44 MB/s
X25 = 46 MB/s * (not bad for an OLD drive)
Half the drives are much slower, but some of the best easily faster.
Conveniently omitting the part where if you are using Windows 7 4k random writes are aligned on 4k boundries. The Sandforce random 4k writes become 162mb/s a whopping margin over Intel G2.
Belard - Monday, May 3, 2010 - link
Do you know that there is a REPLY button? That way your COMMENT would be attached to the post, rather than starting a whole new dis-connected thread.So look to the left, there my name is and you'll see the word REPLY. Give it a shot.
- - - - -
Man, wish there was a QUOTE function as well as the ability to save my LOG-IN on this revised site.
"Conveniently omitting the part where if you are using Windows 7 4k random writes are aligned on 4k boundries. The Sandforce random 4k writes become 162mb/s a whopping margin over Intel G2."
Er... no. I *DID* go with the Win7 performance test. I was comparing the REVIEWED drive to the Intel X25-M. And I ALSO said "but some of the best easily faster."... so I was NOT disregarding the SF drives.
I was expecting people to be able to figure this out.
And when it comes to RANDOM reads... All those SF drives your so concerned with, are easily SLOWER than the X25-M.
Intel X25-M G2 160/80 = 64.3~5 MB/s
Intel X25-M G1 160/80 = 57.9 MB/s
SF 1200~1500s = 49.4~52.1 MB/s... Ouch, SF is slower than the year old G2 and even older G1!! Even losing up to 15MB.s! About 25% slower than intels!
The intel drives were the most expensive... now they are generally cheaper (cost per GB).
I will continue to buy G2 drives (even those without the intel label) for my clients until something that is better across the board comes out. As far as I am concerned, Random Reads are somewhat more important than random reads... and both are about Sequential. This is why Windows7 boots up in about 10~12 seconds vs 35~50sec for a HD on the same same desktop.
And I am not even a big fan of intel. I usually build AMD systems. But I'll buy what is good.
Intel X25-M G2 wins in:
A - price
B - Availability (Many of the OCZs are not even available. Some stores carry older models)
C - Performance Random
D - Performance Sequential (okay, at 256 vs 265.... intel is a bit slower)
E - Reliability
F - TRIM support (Its unclear if all the other drives support TRIM - depending on the Firmware)
From the looks of things, the G2 will lose its position when the G3 comes out.
I plan to get a G3 for my next build... Hopefully it'll be $150~200 for 80GB with SATA 3.0 delivering 375+MB/s Seq Read/Write and 200MB/s for random R/W. That, I would really drool over!