ASRock DeskMeet B660 Review: An Affordable NUC Extreme?
by Ganesh T S on January 23, 2023 8:30 AM EST- Posted in
- Systems
- ASRock
- SilverStone
- SFF
- Mushkin
- Alder Lake
- B660
- DeskMeet
- Raptor Lake
System Performance: Multi-Tasking
One of the key drivers of advancments in computing systems is multi-tasking. On mobile devices, this is quite lightweight - cases such as background email checks while the user is playing a mobile game are quite common. Towards optimizing user experience in those types of scenarios, mobile SoC manufacturers started integrating heterogenous CPU cores - some with high performance for demanding workloads, while others were frugal in terms of both power consumption / die area and performance. This trend is now slowly making its way into the desktop PC space.
Multi-tasking in typical PC usage is much more demanding compared to phones and tablets. Desktop OSes allow users to launch and utilize a large number of demanding programs simultaneously. Responsiveness is dictated largely by the OS scheduler allowing different tasks to move to the background. Intel's Alder Lake processors work closely with the Windows 11 thread scheduler to optimize performance in these cases. Keeping these aspects in mind, the evaluation of multi-tasking performance is an interesting subject to tackle.
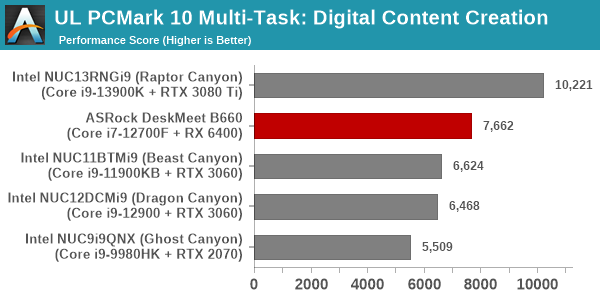
We have augmented our systems benchmarking suite to quantitatively analyze the multi-tasking performance of various platforms. Our previous attempt involved the triggering of a VLC transcoding task to transform 1716 3840x1714 frames encoded as a 24fps AVC video (Blender Project's 'Tears of Steel' 4K version) into a 1080p HEVC version in a loop. VLC internally uses the x265 encoder, and the settings are configured to allow the CPU usage to be saturated across all cores. Unfortunately, with some of the large core-count systems, we found VLC falling back to single-core usage. We have since replaced it with a ffmpeg transcoding task that appears to uniformly load the cores even in the Raptor Canyon NUC. The transcoding rate is monitored continuously. One complete transcoding pass is allowed to complete before starting the first multi-tasking workload - the PCMark 10 Extended bench suite. A comparative view of the PCMark 10 scores for various scenarios is presented in the graphs below. Also available for concurrent viewing are scores in the normal case where the benchmark was processed without any concurrent load, and a graph presenting the loss in performance.
| UL PCMark 10 Load Testing - Digital Content Creation Scores | |||
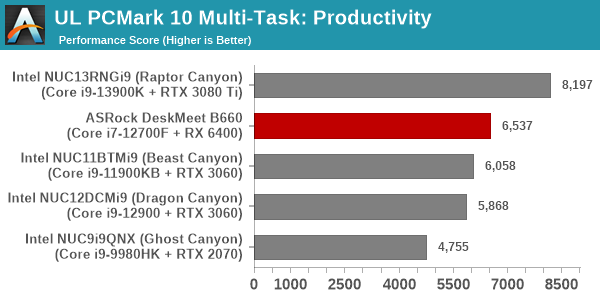
| UL PCMark 10 Load Testing - Productivity Scores | |||
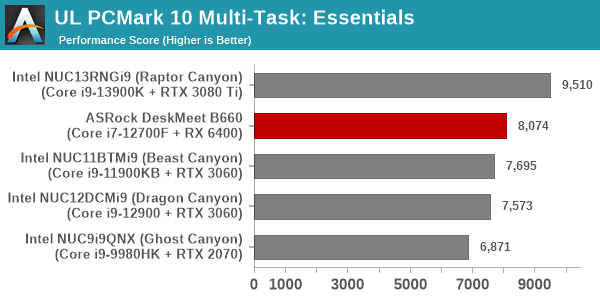
| UL PCMark 10 Load Testing - Essentials Scores | |||
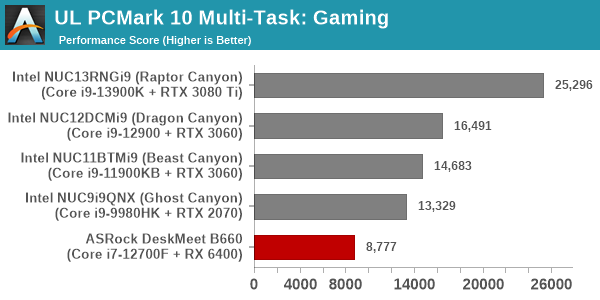
| UL PCMark 10 Load Testing - Gaming Scores | |||
| UL PCMark 10 Load Testing - Overall Scores | |||
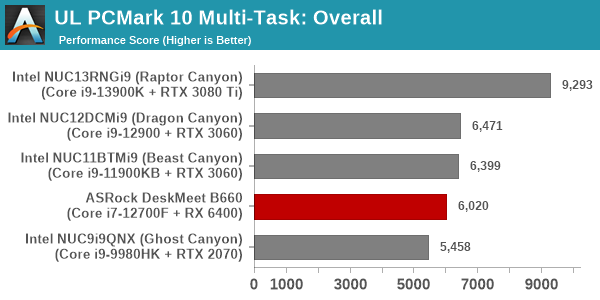
The performance loss in the PCMark workloads range between 25% and 33%, with the DeskMeet B660 managing to score the lowest overall performance loss numbers.
Following the completion of the PCMark 10 benchmark, a short delay is introduced prior to the processing of Principled Technologies WebXPRT4 on MS Edge. Similar to the PCMark 10 results presentation, the graph below show the scores recorded with the transcoding load active. Available for comparison are the dedicated CPU power scores and a measure of the performance loss.
| Principled Technologies WebXPRT4 Load Testing Scores (MS Edge) | |||
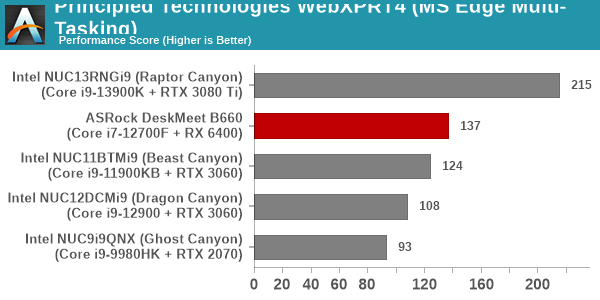
Here, the performance loss for the DeskMeet B660 is heavier, with the extra cores in the Raptor Canyon enabling it to balance both the transcoding and web browsing tasks in a more effective manner.
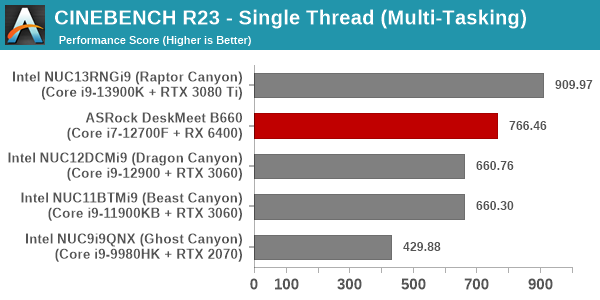
The final workload tested as part of the multitasking evaluation routine is CINEBENCH R23.
| 3D Rendering - CINEBENCH R23 Load Testing - Single Thread Score | |||
| 3D Rendering - CINEBENCH R23 Load Testing - Multiple Thread Score | |||
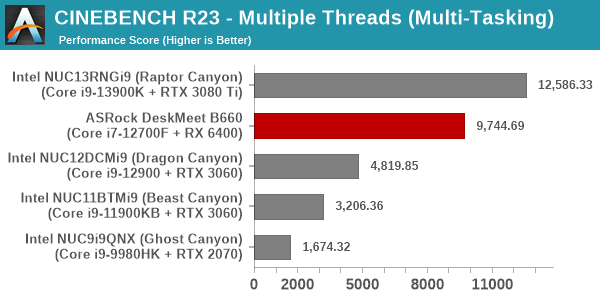
The DeskMeet B660 manage to get back to the top spot in terms of minimizing performance loss with the concurrent load being active.
After the completion of all the workloads, we let the transcoding routine run to completion. The monitored transcoding rate throughout the above evaluation routine (in terms of frames per second) is graphed below.
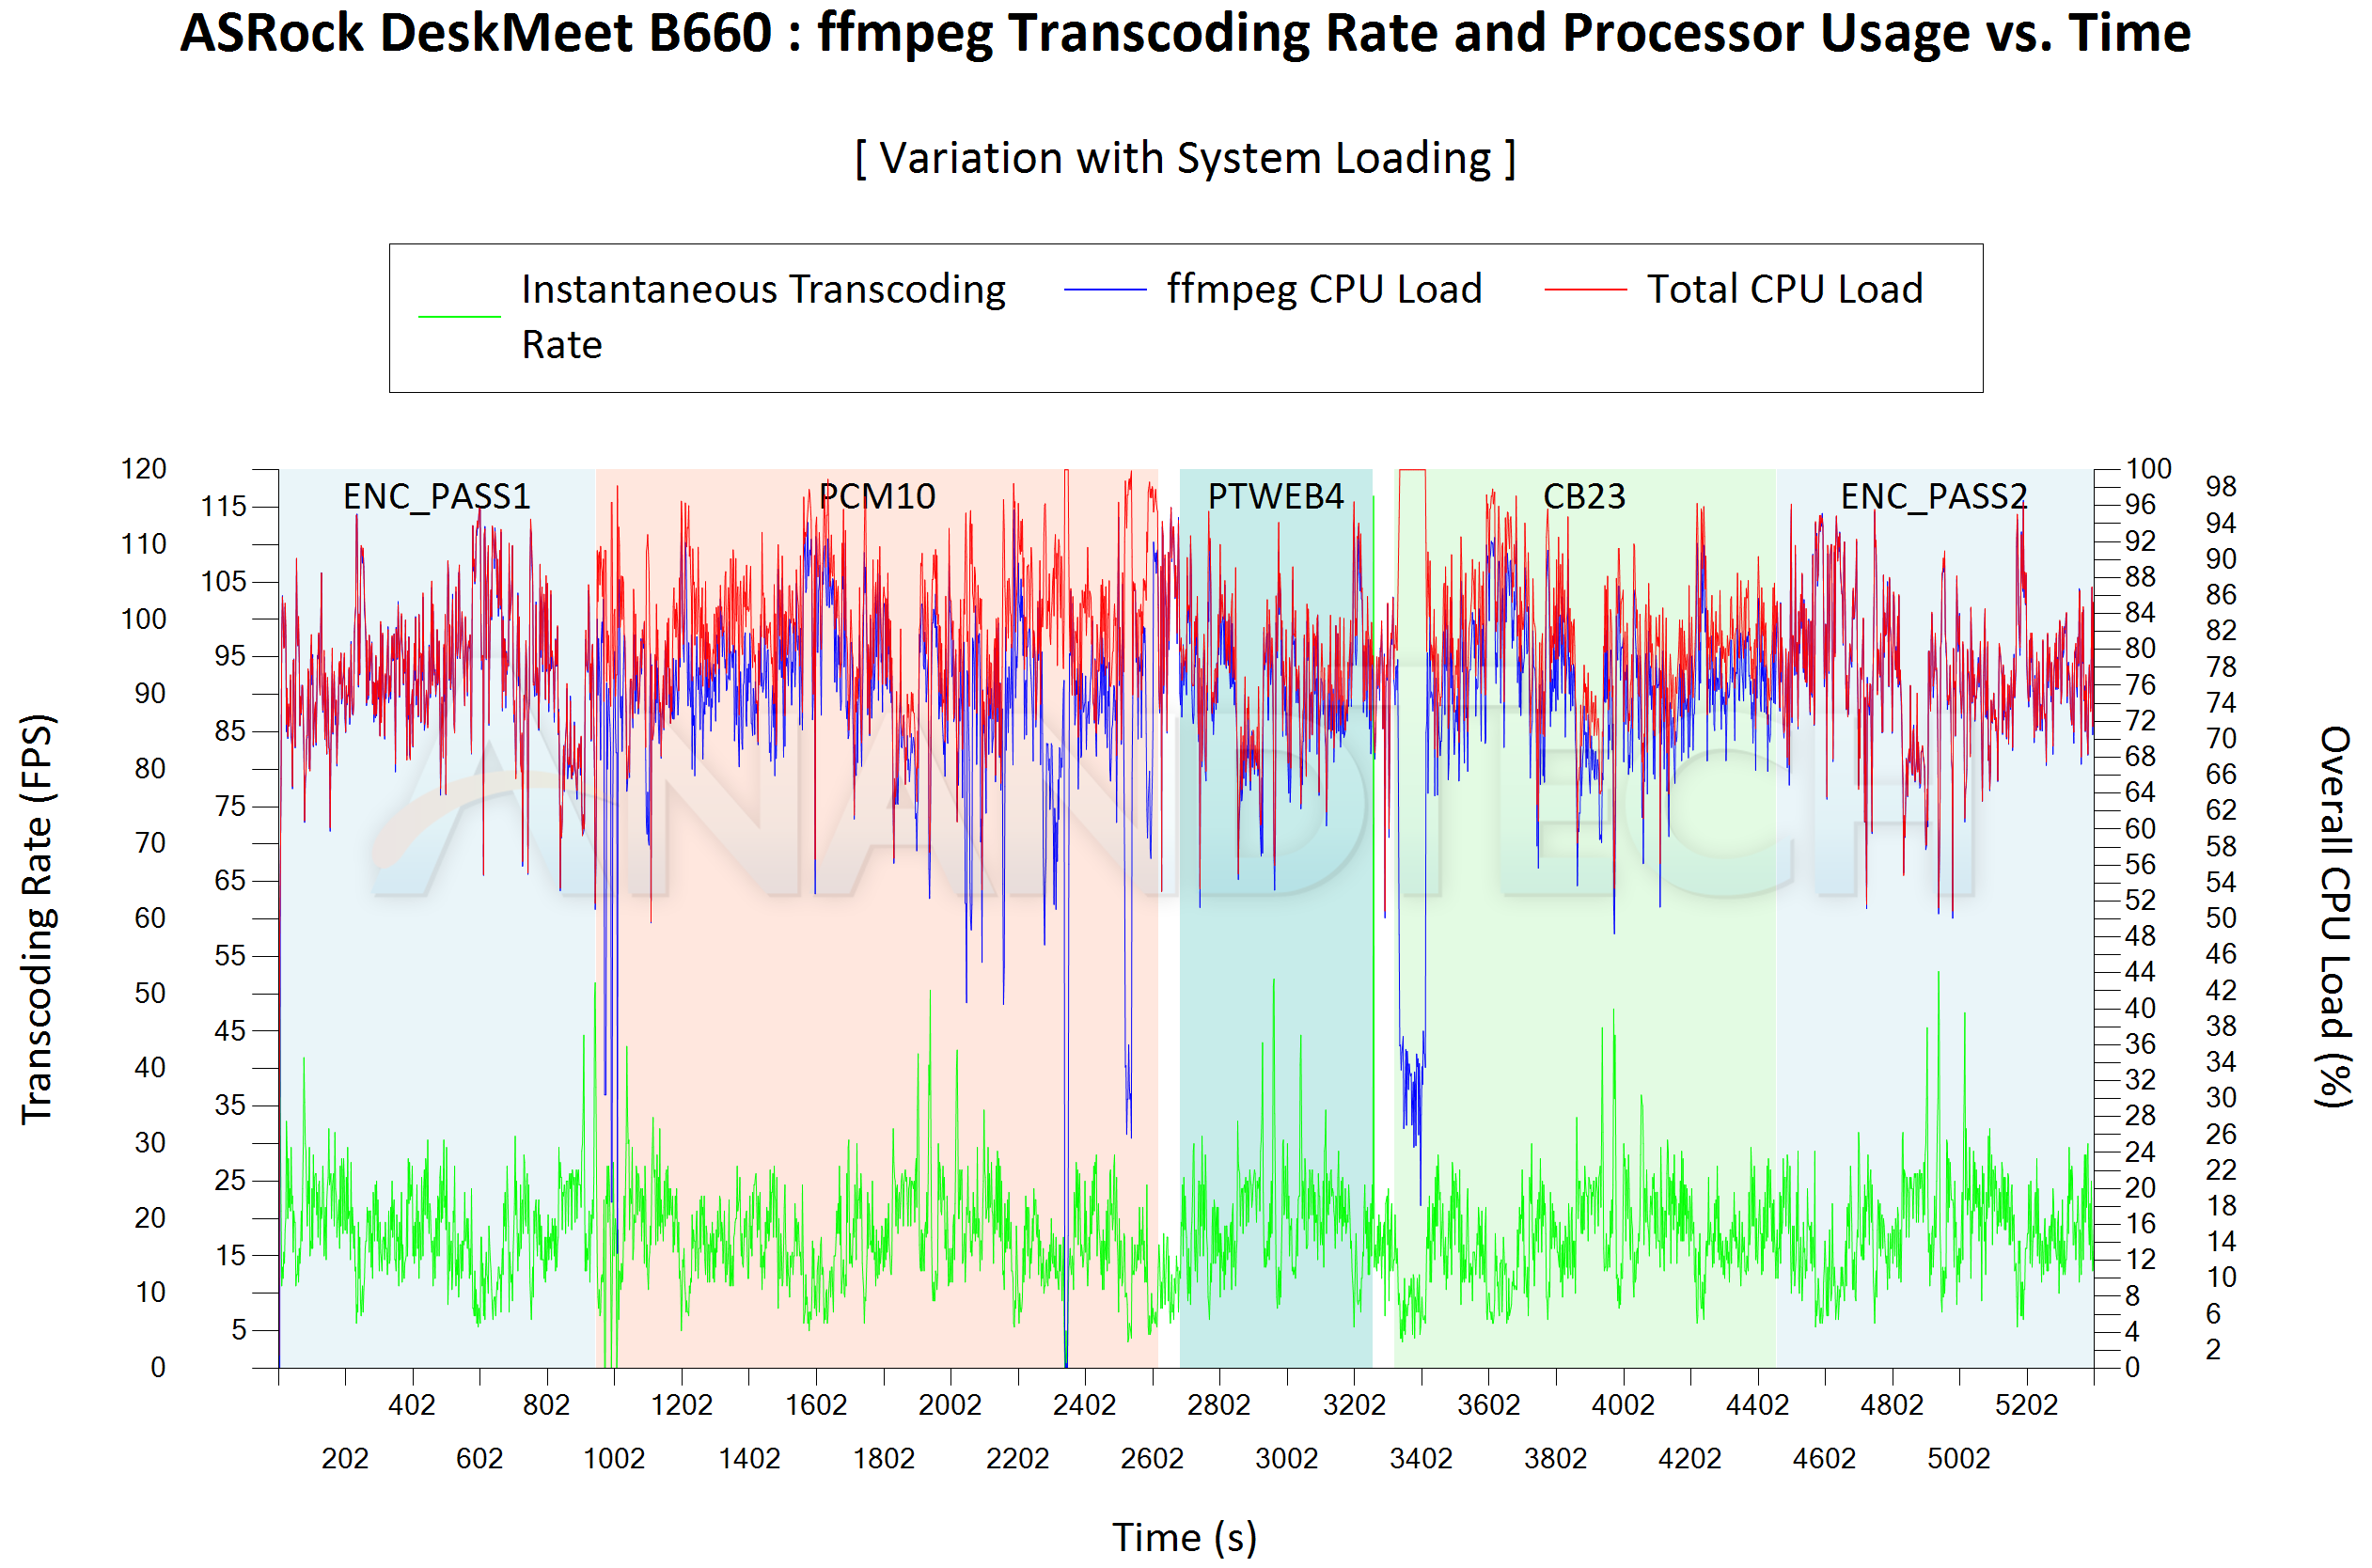
A quantitative view of the transcoding performance in the different stages is presented in the table below.
| ASRock DeskMeet B660 ffmpeg Transcoding Rate (Multi-Tasking Test) | |||
| Task Segment | Transcoding Rate (FPS) | ||
| Minimum | Average | Maximum | |
| Transcode Start Pass | 5.5 | 18.74 | 55 |
| PCMark 10 | 0 | 17.23 | 50.5 |
| WebXPRT 4 | 5.5 | 17.87 | 52 |
| Cinebench R23 | 3.5 | 17.21 | 48 |
| Transcode End Pass | 5.5 | 18.68 | 53 |
Across all phases, the loss in transcoding performance is minimal. During periods of heavy multi-threaded loading like PCMark 10 and Cinebench R23, the transcoding does experience some hiccups, but always recovers within a short while.


27 Comments
View All Comments
lopri - Monday, January 23, 2023 - link
Very thorough and informative. This review is a breadth of fresh air in a sea of toxic commercials masquerading as reviews (of wildly overpriced goods) Thank you.Slash3 - Monday, January 23, 2023 - link
"The CPU package itself doesn't go beyond 80C - a testament to the effectiveness of the Silverstone Hydrogon H90 ARGB cooler."Well, it's also a direct result of running the CPU at a hard 65W PL1/PL2, judging by the flat lines in the adjacent power consumption chart.
Stock PL1 for the 12700F is 65W, with PL2 at 180W, so it looks like the CPU would have been running at base power (and clocks?) for the tests. This would explain lower than expected results in easy to compare tests, such as Cinebench R23 MT. Stock power limits should produce a score of ~19k, with 16k being in line with a 65W limit, as shown in a few reviews elsewhere (TechSpot's 12700+B660 article, for example).
Was this intentional? The test notes show a stated PL1 of 65W and PL2 of 126W, which is a specific power limitation of certain low end ASRock boards (such as the B660M-HDV and likely including this one as well), but it seems like the CPU is *immediately* dipping to 65W, rather than dropping down from 126W after a ~28 second Tau period. Heck, it doesn't even seem to have a one second Tau period.
It's not a massive game-changer, but being able to boost a bit higher with an actual 126W PL2 may give it a little bit more grunt in some MT tests. Might be worth double checking, even if it's just for one extra Cinebench R23 MT 10-minute test to get a more accurate power/frequency chart.
Great review, though! These are capable little cubes.
ganeshts - Monday, January 23, 2023 - link
The BIOS options are left at default as intended by ASRock. It is likely that ASRock believes the case and motherboard power delivery design can only accommodate a PL2 of 126W. PL2 duration was similar to what I have observed in other systems.The cooling situation in the system is a bit challenging. The CPU fan exhausts directly on to the PSU - so, the airflow is not entirely unobstructed. With a 8L chassis volume, and considering that ASRock has gone in for a standard ATX PSU to keep costs low, I am guessing this is the best they could do. The cooling solution in the NUC Extreme models is much more complicated and effective - but that comes with a significant price premium.
boozed - Monday, January 23, 2023 - link
I've always wanted some deskmeatthestryker - Monday, January 23, 2023 - link
Seems like they tried to make this a bit too small where it has all of the negatives of the first NUC Extreme, but manages to be slightly larger. It certainly is cheaper, but it really needs to either be smaller and forego dGPU or longer and support more.meacupla - Tuesday, January 24, 2023 - link
All things considered, the size is pretty good, actually. It's a bit over 8L in size, which is on the smaller size for mITX cases Adding room for a larger GPU would easily bring it over 12L. A similar case that is one size longer is the Silverstone SG13. It accepts longer 2-slot GPUs, but powerful GPUs these days are touting 3 slot designs.I think the design choice of short 2-slot GPU is good, although I think they could have made the overall size smaller by using a SFX PSU.
nandnandnand - Monday, January 23, 2023 - link
I would rather go smaller. Now we can have 96 GB of RAM with 2 DIMM slots.Mr.Vegas - Thursday, January 26, 2023 - link
Op, Is there a 8 pin PCIe power connector on the PSU? there is no info about which cand how many connectors the PSU has, i have 3060 that uses single 8 pin conenctorMr.Vegas - Thursday, January 26, 2023 - link
P.S. Is there any space to glue [double sided tape] a 2.5inch SSD if i use a Dual Slot GPU?Like on the side of the PSU maybe?
ganeshts - Friday, January 27, 2023 - link
I doubt it, and wouldn't recommend even if it were to be possible.