Jasper Lake Fanless Showdown: ECS LIVA Z3 and ZOTAC ZBOX CI331 nano UCFF PCs Review
by Ganesh T S on July 8, 2022 8:30 AM EST- Posted in
- Systems
- ZOTAC
- Fanless
- ECS
- Passive Cooling
- UCFF
- Mini-PC
- Jasper Lake
System Performance: Multi-Tasking
One of the key drivers of advancements in computing systems is multi-tasking. On mobile devices, this is quite lightweight - cases such as background email checks while the user is playing a mobile game are quite common. Towards optimizing user experience in those types of scenarios, mobile SoC manufacturers started integrating heterogeneous CPU cores - some with high performance for demanding workloads, while others were frugal in terms of both power consumption / die area and performance. This trend is now slowly making its way into the desktop PC space.
Multi-tasking in typical PC usage is much more demanding compared to phones and tablets. Desktop OSes allow users to launch and utilize a large number of demanding programs simultaneously. Responsiveness is dictated largely by the OS scheduler allowing different tasks to move to the background. Intel's Alder Lake processors work closely with the Windows 11 thread scheduler to optimize performance in these cases. Keeping these aspects in mind, the evaluation of multi-tasking performance is an interesting subject to tackle.
We have augmented our systems benchmarking suite to quantitatively analyze the multi-tasking performance of various platforms. The evaluation involves triggering a VLC transcoding task to transform 1716 3840x1714 frames encoded as a 24fps AVC video (Blender Project's 'Tears of Steel' 4K version) into a 1080p HEVC version in a loop. VLC internally uses the x265 encoder, and the settings are configured to allow the CPU usage to be saturated across all cores. The transcoding rate is monitored continuously. One complete transcoding pass is allowed to complete before starting the first multi-tasking workload - the PCMark 10 Extended bench suite. A comparative view of the PCMark 10 scores for various scenarios is presented in the graphs below. Also available for concurrent viewing are scores in the normal case where the benchmark was processed without any concurrent load, and a graph presenting the loss in performance.
| UL PCMark 10 Load Testing - Digital Content Creation Scores | |||

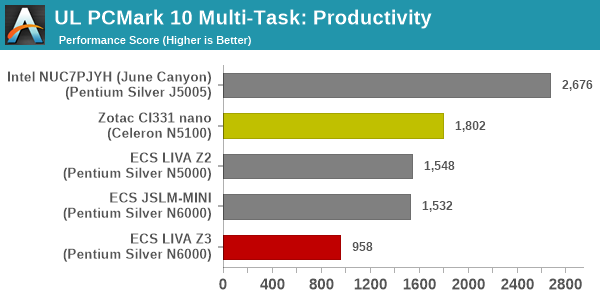
| UL PCMark 10 Load Testing - Productivity Scores | |||
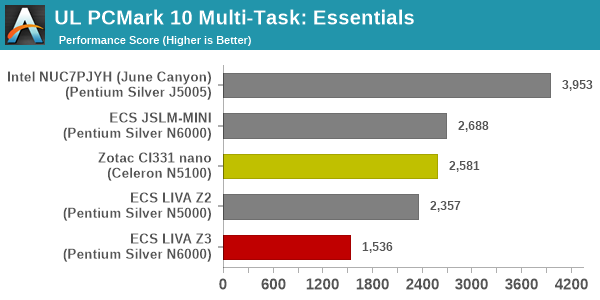
| UL PCMark 10 Load Testing - Essentials Scores | |||
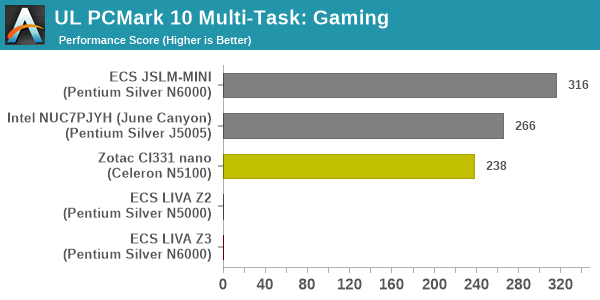
| UL PCMark 10 Load Testing - Gaming Scores | |||
| UL PCMark 10 Load Testing - Overall Scores | |||
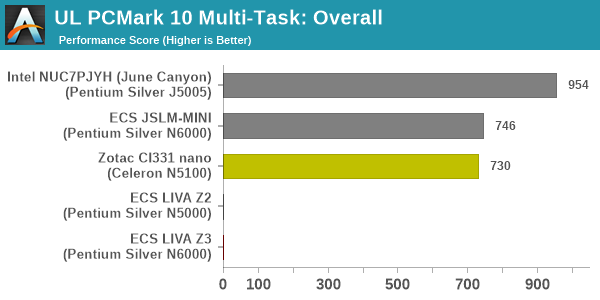
The presence of a transcoding workload in the CPU cores makes handling other tasks an uphill task for low-power PCs. The PCMark 10 workloads above bring out that aspect. The ECS LIVA Z2 and LIVA Z3 are able to only handle the 'Productivity' and 'Essentials' workload components, while ending up with a timeout on others. Other than the 'Gaming' component, we see the June Canyon NUC being most effective at handling multi-tasking due to its actively cooled nature - it has the least performance loss across almost all PCMark 10 components.
Following the completion of the PCMark 10 benchmark, a short delay is introduced prior to the processing of Principled Technologies WebXPRT4 on MS Edge. Similar to the PCMark 10 results presentation, the graph below show the scores recorded with the transcoding load active. Available for comparison are the dedicated CPU power scores and a measure of the performance loss.
| Principled Technologies WebXPRT4 Load Testing Scores (MS Edge) | |||
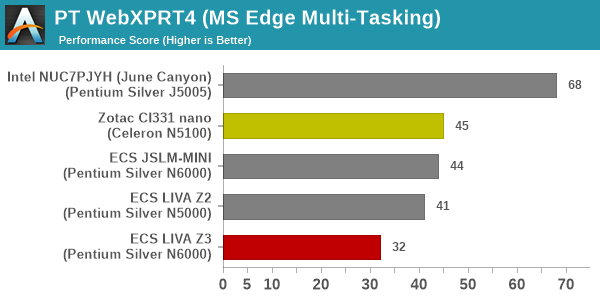
The June Canyon's WebXPRT4 scores are well behind that of the Jasper Lake-based units under normal conditions. However, addition of the transcoding workload results in significant loss in performance for the latter set. The June Canyon has limited performance loss, with its active cooling probably allowing it to go the extra mile in the presence of heavy sustained workloads.
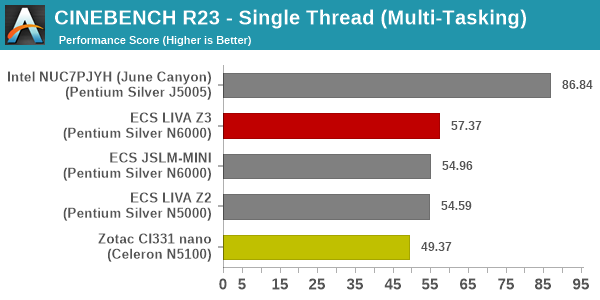
The final workload tested as part of the multitasking evaluation routine is CINEBENCH R23.
| 3D Rendering - CINEBENCH R23 Load Testing - Single Thread Score | |||
| 3D Rendering - CINEBENCH R23 Load Testing - Multiple Thread Score | |||
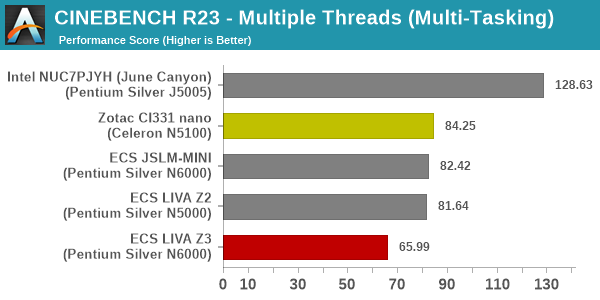
The June Canyon NUC with its active cooling comes out on top with the transcoding load active.
After the completion of all the workloads, we let the transcoding routine run to completion. The monitored transcoding rate throughout the above evaluation routine (in terms of frames per second) is tabulated below.
| VLC Transcoding Rate (Multi-Tasking Test) - Frames per Second | |||||
| Enc. Pass #1 | PCMark 10 | WebXPRT4 | Cinebench | Enc. Pass #2 | |
| ECS LIVA Z3 (Pentium Silver N6000) |
0.1541 | 0.1071 | 0.1294 | 0.1476 | 0.1424 |
| ECS JSLM-MINI (Pentium Silver N6000) |
0.2223 | 0.1635 | 0.1635 | 0.2092 | 0.2216 |
| ZOTAC ZBOX CI331 nano (Celeron N5100) |
0.3016 | 0.1943 | 0.1859 | 0.2025 | 0.1864 |
The transcoding rates drop down with simultaneous loading, as expected. For the JSLM-MINI, the first pass and second pass rates are pretty much equal, pointing to the absence of throttling. However, both the LIVA Z3 and the ZBOX CI331 nano suffer from reduced rates in the second pass - the internal temperatures are high enough for the CPU to be throttled after extended sustained loading.


52 Comments
View All Comments
Oxford Guy - Monday, July 18, 2022 - link
‘No, you're flat-out wrong’That’s nice.
imofullform - Thursday, July 21, 2022 - link
Nice Post