USB 3.2 Gen 2 Portable SSDs Roundup - Featuring the Samsung T7 Touch and the SanDisk Extreme Pro
by Ganesh T S on January 23, 2020 9:00 AM ESTPCMark 10 Storage Bench - Real-World Access Traces
There are a number of storage benchmarks that can subject a device to artificial access traces by varying the mix of reads and writes, the access block sizes, and the queue depth / number of outstanding data requests. We saw results from two popular ones - ATTO, and CrystalDiskMark - in a previous section. More serious benchmarks, however, actually replicate access traces from real-world workloads to determine the suitability of a particular device for a particular workload. Real-world access traces may be used for simulating the behavior of computing activities that are limited by storage performance. Examples include booting an operating system or loading a particular game from the disk.
PCMark 10's storage bench (introduced in v2.1.2153) includes four storage benchmarks that use relevant real-world traces from popular applications and common tasks to fully test the performance of the latest modern drives:
- The Full System Drive Benchmark uses a wide-ranging set of real-world traces from popular applications and common tasks to fully test the performance of the fastest modern drives. It involves a total of 204 GB of write traffic.
- The Quick System Drive Benchmark is a shorter test with a smaller set of less demanding real-world traces. It subjects the device to 23 GB of writes.
- The Data Drive Benchmark is designed to test drives that are used for storing files rather than applications. These typically include NAS drives, USB sticks, memory cards, and other external storage devices. The device is subjected to 15 GB of writes.
- The Drive Performance Consistency Test is a long-running and extremely demanding test with a heavy, continuous load for expert users. In-depth reporting shows how the performance of the drive varies under different conditions. This writes more than 23 TB of data to the drive.
Despite the data drive benchmark appearing most suitable for testing direct-attached storage, we opted to run the full system drive benchmark as part of our evaluation flow. Many of us use portable flash drives as boot drives and storage for Steam games. These types of use-cases are addressed only in the full system drive benchmark.
The Full System Drive Benchmark comprises of 23 different traces. For the purpose of presenting results, we classify them under five different categories:
- Boot: Replay of storage access trace recorded while booting Windows 10
- Creative: Replay of storage access traces recorded during the start up and usage of Adobe applications such as Acrobat, After Effects, Illustrator, Premiere Pro, Lightroom, and Photoshop.
- Office: Replay of storage access traces recorded during the usage of Microsoft Office applications such as Excel and Powerpoint.
- Gaming: Replay of storage access traces recorded during the start up of games such as Battlefield V, Call of Duty Black Ops 4, and Overwatch.
- File Transfers: Replay of storage access traces (Write-Only, Read-Write, and Read-Only) recorded during the transfer of data such as ISOs and photographs.
PCMark 10 also generates an overall score, bandwidth, and average latency number for quick comparison of different drives. The sub-sections in the rest of the page reference the access traces specified in the PCMark 10 Technical Guide.
Booting Windows 10
The read-write bandwidth recorded for each drive in the boo access trace is presented below.
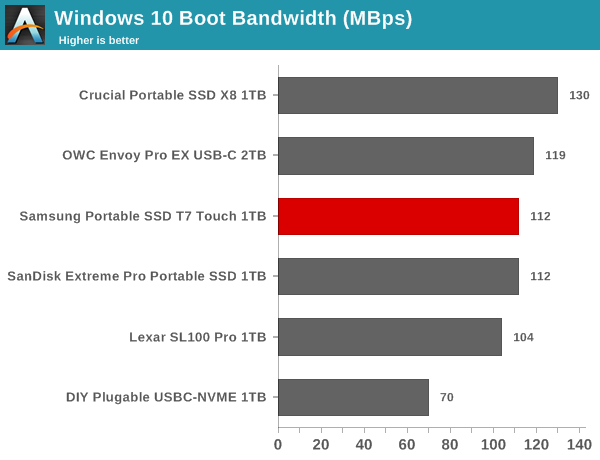
The Crucial X8 appears to be the best of the lot for this workload, while the other new drives are clustered between 104 MBps and 120 MBps. Given the amount of data traffic involved, the gulf is unlikely to result in a major difference in the boot times with various drives.
Creative Workloads
The read-write bandwidth recorded for each drive in the sacr, saft, sill, spre, slig, sps, aft, exc, ill, ind, psh, and psl access traces are presented below.
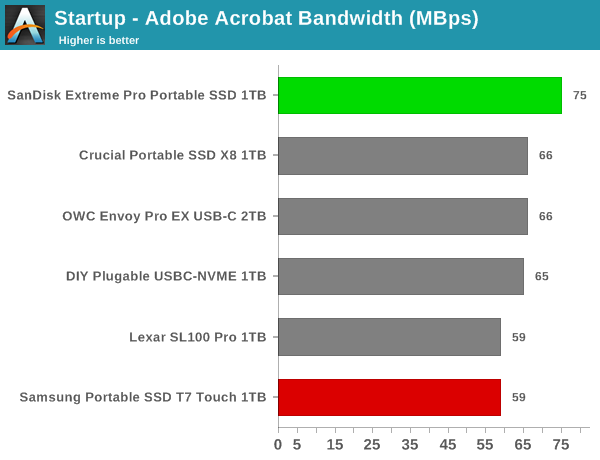
The SanDisk Extreme Pro Portable SSD offers the best startup times overall for different programs used in creative workloads. For usage after startup, the drive is a middling performer, though it comes out on top in a couple of relevant traces. The disappointing aspect is that the T7 Touch doesn't really shine as might be expected.
Office Workloads
The read-write bandwidth recorded for each drive in the exc and pow access traces are presented below.
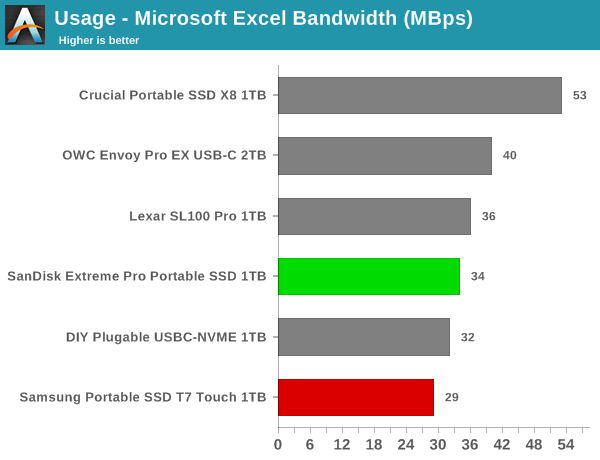
The X8 wins out in the office workloads, with the SanDisk and Samsung units coming in the bottom half of the graph.
Gaming Workloads
The read-write bandwidth recorded for each drive in the bf, cod, and ow access traces are presented below.
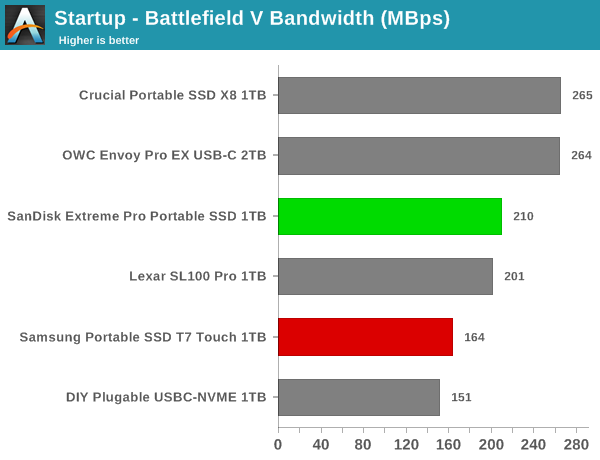
The X8 again wins out here, with the Extreme Pro in the middle of the pack and the T7 Touch in the lower half.
Files Transfer Workloads
The read-write bandwidth recorded for each drive in the cp1, cp2, cp3, cps1, cps2, and cps3 access traces are presented below.
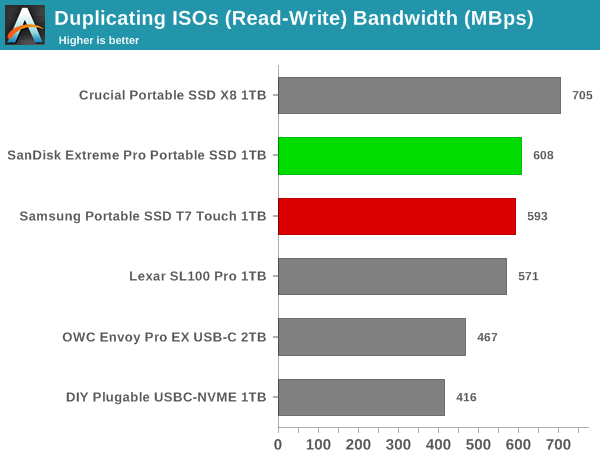
The X8 and the OWC Envoy Pro EX keeps coming on top for the file transfer cases. The Extreme Pro remains in the top half mostly, while the T7 Touch right behind it.
Overall Scores
PCMark 10 reports an overall score based on the observed bandwidth and access times for the full workload set. The score, bandwidth, and average access latency for each of the drives are presented below.
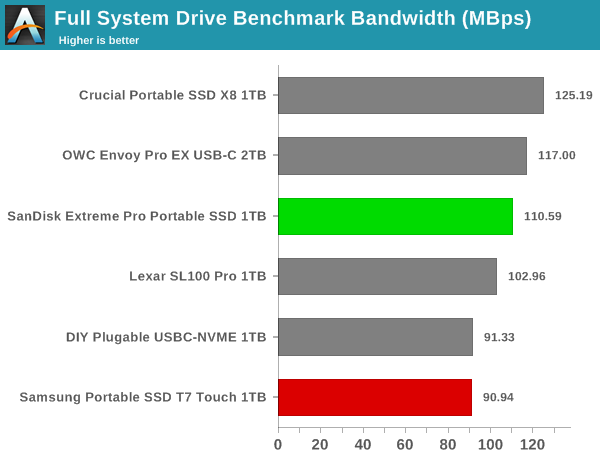
With an overall PCMark 10 full system drive benchmark score of 561, the T7 Touch comes in last among the considered DAS devices. The Extreme Pro scores a more respectable 683, but the Crucial X8 leas the pack with a 765.


38 Comments
View All Comments
zebrax2 - Thursday, January 23, 2020 - link
For the ATTO you can probably create 2 line charts, for bytes and IO, with the read having solid lines and writes using dashed lines and lighter colors for example.As for CDM something similar to the charts here
https://www.anandtech.com/show/15207/the-snapdrago...
Anyway this is only my suggestion. If you do decide to keep the current layout may I at least suggest to have the expand all options on all the benchmark (e.g. the ATTO and CDM results doesn't have this option)
mm0zct - Thursday, January 23, 2020 - link
I agree that it's not helpful to have all the comparisons separate, hidden under pulldown (can we get consolidated comparison graphs please?), but I'd also be interested to see the T5 in here for comparison as a SATA based USB3.1 gen2 drive.MScrip - Thursday, January 23, 2020 - link
Exactly. It would be nice to include a comparison to Samsung's previous highly-regarded SSD... the venerable Samsung T5 drive.Whenever there is a new version of a device... it's customary to compare it to the previous generation.
It appears that Anandtech is strictly comparing MVNe drives here. But it would still be helpful for T5 owners.
R3MF - Thursday, January 23, 2020 - link
is it fair to say that if you want ssd file storage that requires sustained sequential writes to 90% of disk capacity then you won't actually lose much performance by going for a sata based solution over the shiny new usb>PCI3.0 4x nvme?i.e. all that pcie bandwidth tends to be useful only for bursty activity until the SLC/ram cache is exhausted and cannot sustain full bandwidth write speeds.
Billy Tallis - Thursday, January 23, 2020 - link
Most high-end consumer NVMe SSDs can average at least 1GB/s for a whole drive write to their 1TB models. Several average 1.5GB/s or higher, even though they are still using TLC with SLC caching. So it's definitely possible to do far better than SATA-based portable storage, but it may require a higher class of NVMe drive than some portable SSDs use.R3MF - Friday, January 24, 2020 - link
thank you.recently bought a 2tb sata drive for storage.
think i'll be happy with 540MB/s vs 80MB/s for a 2.5" portable, enough that i won't miss a doubling to 1GB/s too much.
AnarchoPrimitiv - Sunday, January 26, 2020 - link
If you need the fastest performance and do not have a Thunderbolt 3 port, I'd recommend buying the newly released USB 3.2 Gen2x2 add in card released by Gigabyte if I remember correctly. It is capable of 20Gbps (so double the speed of these drives) and Western Digital just released their external P50 drive which can saturate the connection with sequential r/w at 2000MB/s. Or if you'd rather make a DIY solution with an enclosure, I believe Asmedia has released a bridge chip for USB 3.2 Gen2x2 so I'd expect enclosures to hit the market soonHStewart - Thursday, January 23, 2020 - link
One thing good about forthcoming USB4 is that Thunderbolt 3 will be full stream and prices of TB3 drives will be coming down.Korguz - Thursday, January 23, 2020 - link
maybe . but will intel still have to certify it ?? if so... that is a major hurdle for any TB device to be adopted and used....Dragonstongue - Thursday, January 23, 2020 - link
mehhh QLC (whatever want to call them) should be that much lower cost to consumer than prices I have seen as of late, likely save the company who makes them a whole whack per die (per drive) vs "regular" such as TLC certainly vs MLC and significant price difference vs the much prefered SLC design, overall has not dropped price as much as I would expect if I am to be completely honest, in other words, the makers want as many of them sold as possible to reap the RnD by making them in the first place, but at same time do not seem overly "keen" on putting on the shelves around the world at "ok" price point.That $169 easily becomes in the $240+ range most other places than USA which makes something that "seems" pretty reasonable price run into the area of "why bother when spinning rust is much much lower cost, even if slower"
mehh is all I can personally say, though thank you for the review overall ^.^