Seagate Backup Plus Portable 5TB & Backup Plus Slim 2TB Review: SMR for the Consumer Market
by Ganesh T S on June 18, 2019 8:00 AM ESTDirect-Attached Storage Benchmarks
Our evaluation routine for hard-drive based direct-attached storage devices borrows heavily from the testing methodology for flash-based direct-attached storage devices. The testbed hardware (the Thunderbolt 3 / USB 3.1 Gen 2 Type-C port enabled by the Alpine Ridge host controller in the Hades Canyon NUC) is reused. CrystalDiskMark is used for a quick performance overview. Real-world performance testing is done with our custom test suite involving robocopy bencharks and PCMark 8's storage bench.
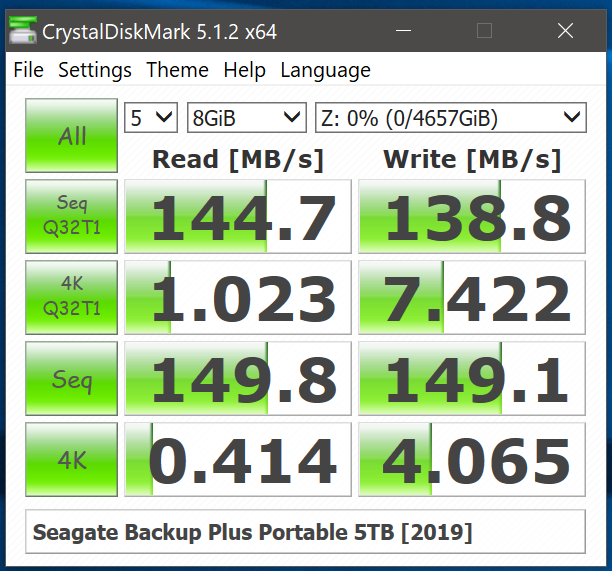
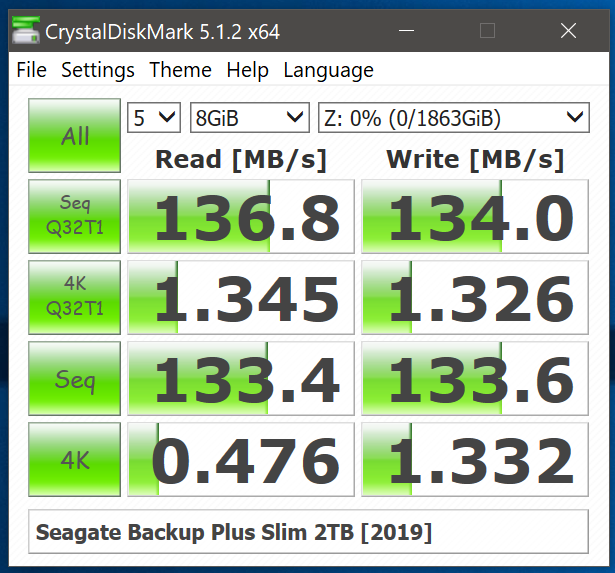
CrystalDiskMark uses four different access traces for reads and writes over a configurable region size. Two of the traces are sequential accesses, while two are 4K random accesses. Internally, CrystalDiskMark uses the Microsoft DiskSpd storage testing tool. The 'Seq Q32T1' sequential traces use 128K block size with a queue depth of 32 from a single thread, while the '4K Q32T1' ones do random 4K accesses with the same queue and thread configurations. The plain 'Seq' traces use a 1MiB block size. The plain '4K' ones are similar to the '4K Q32T1' except that only a single queue and single thread are used.
Comparing the '4K Q32T1' and '4K' numbers can quickly tell us whether the storage device supports NCQ (native command queuing) / UASP (USB-attached SCSI protocol). If the numbers for the two access traces are in the same ballpark, NCQ / UASP is not supported. This assumes that the host port / drivers on the PC support UASP. We can see that the Seagate Backup Plus external storage drives do support NCQ and UASP. Performance numbers are typical of what one might expect from a 5400 RPM hard drive, with peak performance close to 150 MBps for the 5TB Backup Plus Portable and around 135 MBps for the 2TB Backup Plus Slim.
| HDD-Based Direct-Attached Storage Benchmarks - CrystalDiskMark | ||
 |
 |
|
Moving on to the real-world benchmarks, we first look at the results from our custom robocopy test. In this test, we transfer three folders with the following characteristics.
- Photos: 15.6 GB collection of 4320 photos (RAW as well as JPEGs) in 61 sub-folders
- Videos: 16.1 GB collection of 244 videos (MP4 as well as MOVs) in 6 sub-folders
- BR: 10.7 GB Blu-ray folder structure of the IDT Benchmark Blu-ray (the same that we use in our robocopy tests for NAS systems)
The test starts off with the Photos folder in a RAM drive in the testbed. robocopy is used with default arguments to mirror it onto the storage drive under test. The content on the RAM drive is then deleted. robocopy is again used to transfer the content, but, from the storage drive under test to the RAM drive. The first segment gives the write speed, while the second one gives the read speed for the storage device. The segments end with the purge of the contents from the storage device. This process is repeated thrice and the average of all the runs is recorded as the performance number. The same procedure is adopted for the Videos and the BR folders.
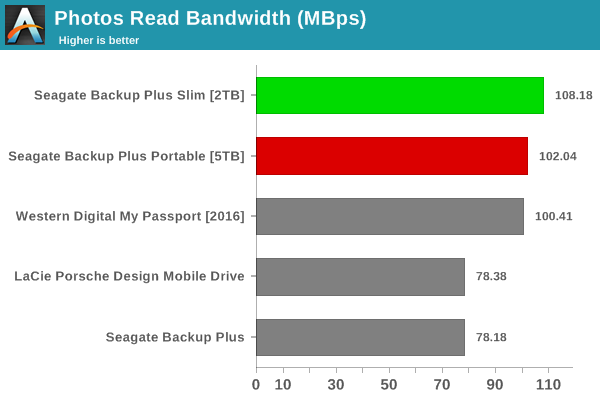
The 5TB Backup Plus Portable comes out on top in a couple of workloads, as does the 2TB Backup Plus Slim. However, the relative positions across different workloads are not consistent. This indicates that performance consistency under sustained traffic is not predictable for these drives.
High-performance external storage devices can also be used for editing multimedia files directly off the unit. They can also be used as OS-to-go boot drives. Evaluation of this aspect is done using PCMark 8's storage bench. The storage workload involves games as well as multimedia editing applications. The command line version allows us to cherry-pick storage traces to run on a target drive. We chose the following traces.
- Adobe Photoshop (Light)
- Adobe Photoshop (Heavy)
- Adobe After Effects
- Adobe Illustrator
Usually, PC Mark 8 reports time to complete the trace, but the detailed log report has the read and write bandwidth figures which we present in our performance tables. Note that the bandwidth number reported in the results don't involve idle time compression. Results might appear low, but that is part of the workload characteristic. Note that the same CPU is being used for all configurations. Therefore, comparing the numbers for each trace should be possible across different DAS units.
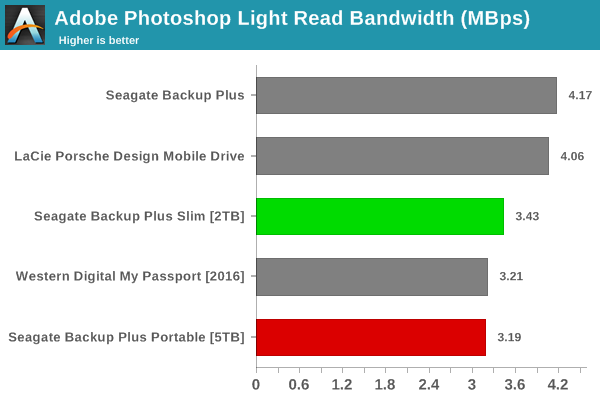
The lack of performance consistency is more pronounced in these benchmarks. In fact, the two drives being reviewed today appear in the bottom half of the graphs more often than not. The reason for this requires deeper investigation into SMR characteristics, and this is presented in the next section.


62 Comments
View All Comments
MASSAMKULABOX - Tuesday, June 18, 2019 - link
It should soon ... (?) be able to get a 1tb SSD for 80GBp .. at those sorts of prices I would prefer SSD to HDD. But anything larger is still too expensive ...QLC ????MASSAMKULABOX - Tuesday, June 18, 2019 - link
BTW those graphs are JAckson Pollocks(cockney RS)
Cygni - Tuesday, June 18, 2019 - link
imagine still using "LUL" in 2k19DigitalFreak - Tuesday, June 18, 2019 - link
First!cbm80 - Tuesday, June 18, 2019 - link
"While Western Digital and Toshiba use conventional magnetic recording (CMR) for their 2.5" hard drives, Seagate makes use of shingled magnetic recording (SMR)."I don't think so. They all use SMR for current models.
ganeshts - Tuesday, June 18, 2019 - link
I demonstrated that the WD My Passport 4TB drive is not SMR-based in the review, and WD has not updated the capacity point since that drive was launched. All the Toshiba Canvio drives top out at 4TB - at that capacity, there is no need to use SMR.Sunday Afternoon - Tuesday, June 18, 2019 - link
Your WD drive is from 2016. Are you sure that 4TB WD drives from 2019 are CMR?cbm80 - Tuesday, June 18, 2019 - link
The "need" is you can build a 4TB drive with 4 platters instead of 5. WD could have made a 5TB model but chose not to for some reason.MGJ - Wednesday, June 19, 2019 - link
Again as said in this thread (https://forums.anandtech.com/threads/what-consumer... for 2.5 inches hard disk drive:WD Blue WD20SPZX (2TB) and WD10SPZX (1TB),
Toshiba HDWL120EZSTA (2TB), HDWL120UZSVA (2TB), HDWL110EZSTA (1TB), HDWL110UZSVA (1TB), HDWJ110EZSTA (1TB), HDWJ110UZSVA (1TB), MQ04ABD200 (2TB), MQ04ABF100 (1TB)
These products are largely integrated in external USB enclosure (Toshiba Canvio, WD Elements, WD My Passport)
kepstin - Tuesday, June 18, 2019 - link
These SMR drives seem to behave a lot more like SSDs than classic hard drives. The CMR section works similarly to SLC cache, the SMR regions are sort of like erase blocks, and I assume the drives do background GC to move data from cache to SMR regions. It's not clear from this review if there's performance degradation on a full drive like SSDs?I wonder if trim support would help the controller keep consistency up.