The Crucial P1 1TB SSD Review: The Other Consumer QLC SSD
by Billy Tallis on November 8, 2018 9:00 AM ESTBAPCo SYSmark 2018
BAPCo's SYSmark 2018 is an application-based benchmark that uses real-world applications to replay usage patterns of business users, with subscores for productivity, creativity and responsiveness. Scores represnt overall system performance and are calibrated against a reference system that is defined to score 1000 in each of the scenarios. A score of, say, 2000, would imply that the system under test is twice as fast as the reference system.
SYSmark scores are based on total application response time as seen by the user, including not only storage latency but time spent by the processor. This means there's a limit to how much a storage improvement could possibly increase scores, because the SSD is only in use for a small fraction of the total test duration. This is a significant difference from our ATSB tests where only the storage portion of the workload is replicated and disk idle times are cut short to a maximum of 25ms.
| AnandTech SYSmark SSD Testbed | |
| CPU | Intel Core i5-7400 |
| Motherboard | ASUS PRIME Z270-A |
| Chipset | Intel Z270 |
| Memory | 2x 8GB Corsair Vengeance DDR4-2400 CL17 |
| Case | In Win C583 |
| Power Supply | Cooler Master G550M |
| OS | Windows 10 64-bit, version 1803 |
Our SSD testing with SYSmark uses a different test system than the rest of our SSD tests. This machine is set up to measure total system power consumption rather than just the drive's power. The test is run five times in a row on each hardware configuration, and the average scores are reported below.
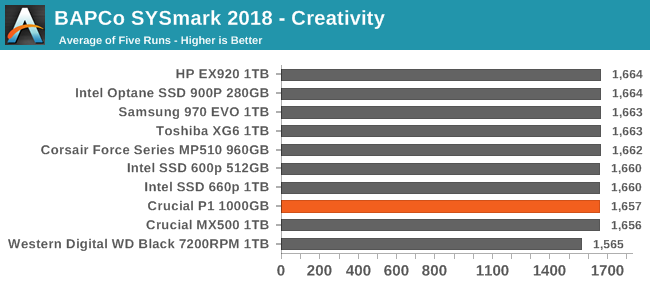
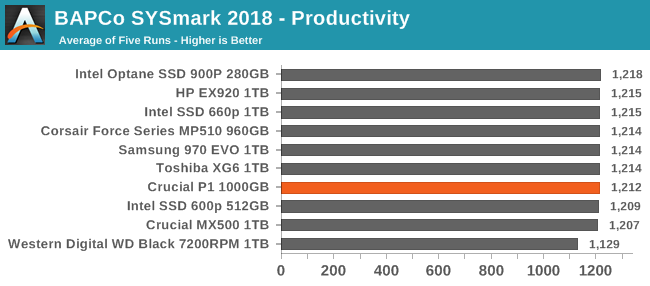
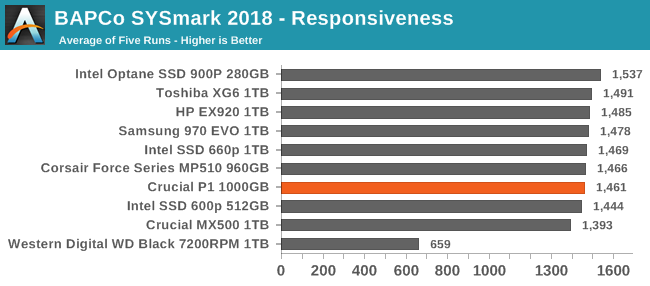
The creativity and productivity scenarios are relatively unaffected by storage performance, and depend much more on compute power. The responsiveness scores are more dependent on storage performance, but even so the differences between SSDs are fairly small. The Crucial P1 is outperforms the MX500 SATA drive but is a bit slower than the high-end NVMe drives.
Energy Usage
The SYSmark energy usage scores measure total system power consumption, excluding the display. Our SYSmark test system idles at around 26 W and peaks at over 60 W measured at the wall during the benchmark run. SATA SSDs seldom exceed 5 W and idle at a fraction of a watt, and the SSDs spend most of the test idle. This means the energy usage scores will inevitably be very close. A typical notebook system will tend to be better optimized for power efficiency than this desktop system, so the SSD would account for a much larger portion of the total and the score difference between SSDs would be more noticeable.
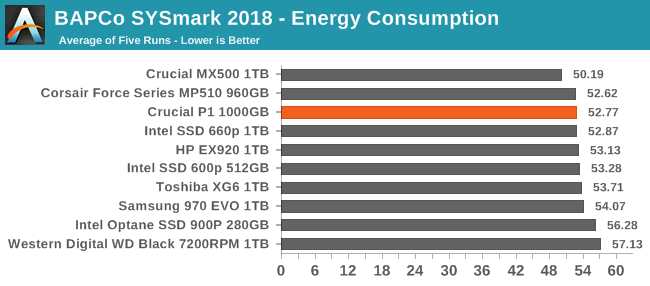
The energy consumption scores for the SSDs reflect the general trend that higher performance comes with the cost of worse power efficiency. SATA SSDs still lead the rankings for most efficient drive, and the hard drive that's included for comparison purposes required more energy than even the power-hungry Intel Optane SSD 900P.


66 Comments
View All Comments
Mikewind Dale - Thursday, November 8, 2018 - link
Sic:"A reduction in quantity and an increase in price will increase net revenue only if demand is elastic."
That should be "inelastic."
limitedaccess - Thursday, November 8, 2018 - link
The transition to TLC drives was also shortly followed with the transition to 3D NAND using higher process (larger) from smaller planar litho process. While smaller litho allowed more density it also came with the trade off of worse endurance/higher decay. So the transition to 3D NAND effectively offset the issues of MLC->TLC which is where we are today. What's the equivalent for TLC->QLC?Low litho planar TLC drives were the ones that were poorly received and performed worse then they reviewed in reality due to decay. And decay is the real issue here with QLC since no reviewer tests for it (it isn't the same as poor write endurance). Is that file I don't regularly access going to maintain the same read speeds or have massively higher latency to access due to the need for ECC to kick in?
0ldman79 - Monday, November 12, 2018 - link
I may not be correct on the exact numbers, but I think the NAND lithography has stopped at 22nm as they were having issues retaining data on 14nm, just no real benefit going to a smaller lithography.They may tune that in a couple of years, but the only way I can see that working with my rudimentary understanding of the system is to keep everything the same size as the 22nm (gates, gaps, fences, chains, roads, whatever, it's too late/early for me to remember the correct terms), same gaps only on a smaller process. They'd have no reduction in cost as they'd be using the same amount of each wafer, might have a reduction in power consumption.
I'm eager to see how they address the problem but it really looks like QLC may be a dead end. Eventually we're going to hit walls where lithography can't improve and we're going to have to come at the problem (cpu speed, memory speeds, NAND speeds, etc) from an entirely different angle than what we've been doing. For what, 40 years, we've been doing major design changes every 5 years or so and just relying on lithography to improve clock speeds.
I think that is about to cease entirely. They can probably go farther than what we're seeing but not economically.
Lolimaster - Friday, November 9, 2018 - link
Youre not specting a drive limited to 500MB to be as fast as a PCI-E 4x SSD with full support for it...TLC vs MLC all goes to endurance and degraded performance when the drive is full or the cache is exhausted.
Lolimaster - Friday, November 9, 2018 - link
Random performance seems the land of Optane and similar. Even the 16GB optane M10 absoluletely murders even the top of the line NVME Samsung MLC SSD.PaoDeTech - Thursday, November 8, 2018 - link
Yes, price is still too high. But it will come down. I think that the conclusions fail to highlight the main strength of this SSD: top performance / power. For portable devices, this is the key metric to consider. In this regard is far ahead any SATA SSD and almost all PCIe out there.Lolimaster - Friday, November 9, 2018 - link
Exactly. QLC should stick to big multiterabyte drives for avrg user or HEDT.Like 4TB+.
0ldman79 - Monday, November 12, 2018 - link
I think that's where they need to place QLC.Massive "read mostly" storage. xx layer TLC for a performance drive, QLC for massive data storage, ie; all of my Steam games installed on a 10 cent per gig "read mostly" drive while the OS and my general use is on a 22 cent per gig TLC.
That's what they're trying to do with that SLC cache, but I think they need to push it a lot farther, throw a 500GB TLC cache on a 4 terabyte QLC drive. That might be able to have it fit into the mainstream NVME lineup.
Flunk - Thursday, November 8, 2018 - link
MSRP seems a little high, I recently picked up an HP EX920 1TB for $255 and that's a much faster drive. Perhaps the street price will be lower.B3an - Thursday, November 8, 2018 - link
That latency is APPALLING and the performance is below par. If this was dirt cheap it might be worth it to some people, but at that price it's a joke.